Hydrograph Explorer Help
Getting Started
This document provides guidance to get started with the ORMGP’s Hydrograph Explorer Tool.
Opening the Hydrology Explorer
The ORMGP Hydrograph Explorer is a set of graphing and interpretation tools that allow users to examine hydrologic and hydrogeologic data within the ORMGP study area. The tools can be used to view X-Y plots of water-level data for groundwater and surface-water locations. Data sources include the ORMGP database and various online sources.
Upon opening the Hydrograph Explorer, the user will see a basemap with an options menu on the right-hand side, as shown in Figure 1, below. Notice that the window is called sHydrology.
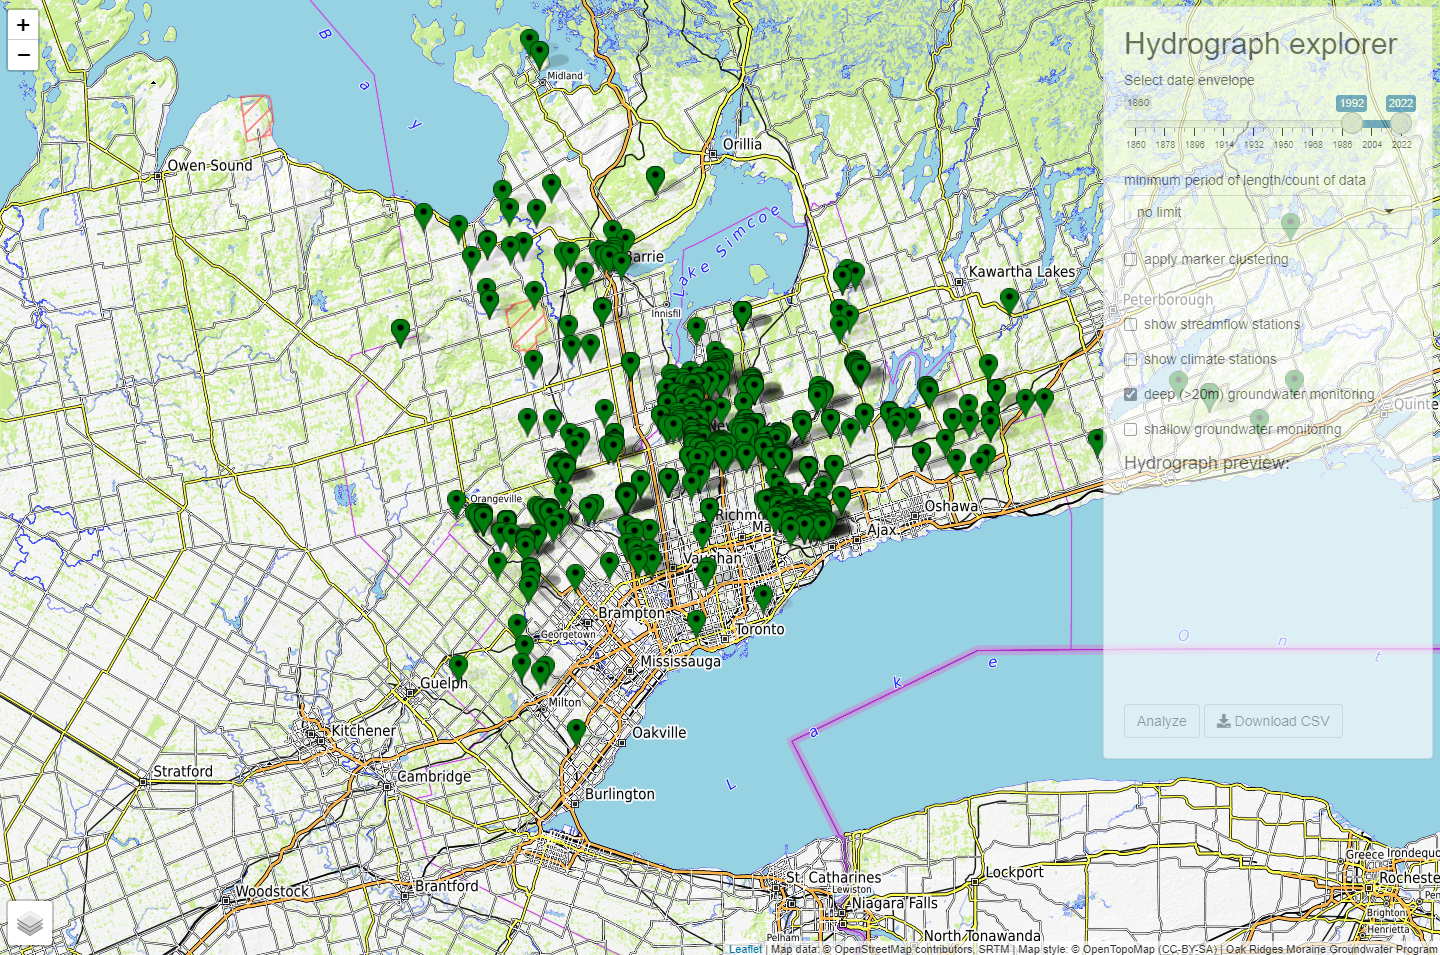
Figure 1: ORMGP Hydrograph Explorer
Filtering Dates
Users can select the date envelope in the upper-right, in the menu. The minimum and maximum dates are selected with the slider bar. Once the min and max dates are selected, the map will refresh with locations that include data from within the date envelope. There’s also an option to select the minimum period of data. Selecting 10 years (for example) from the dropdown menu will show locations that include at least 10 years of data. These two features are shown in Figure 2 below:
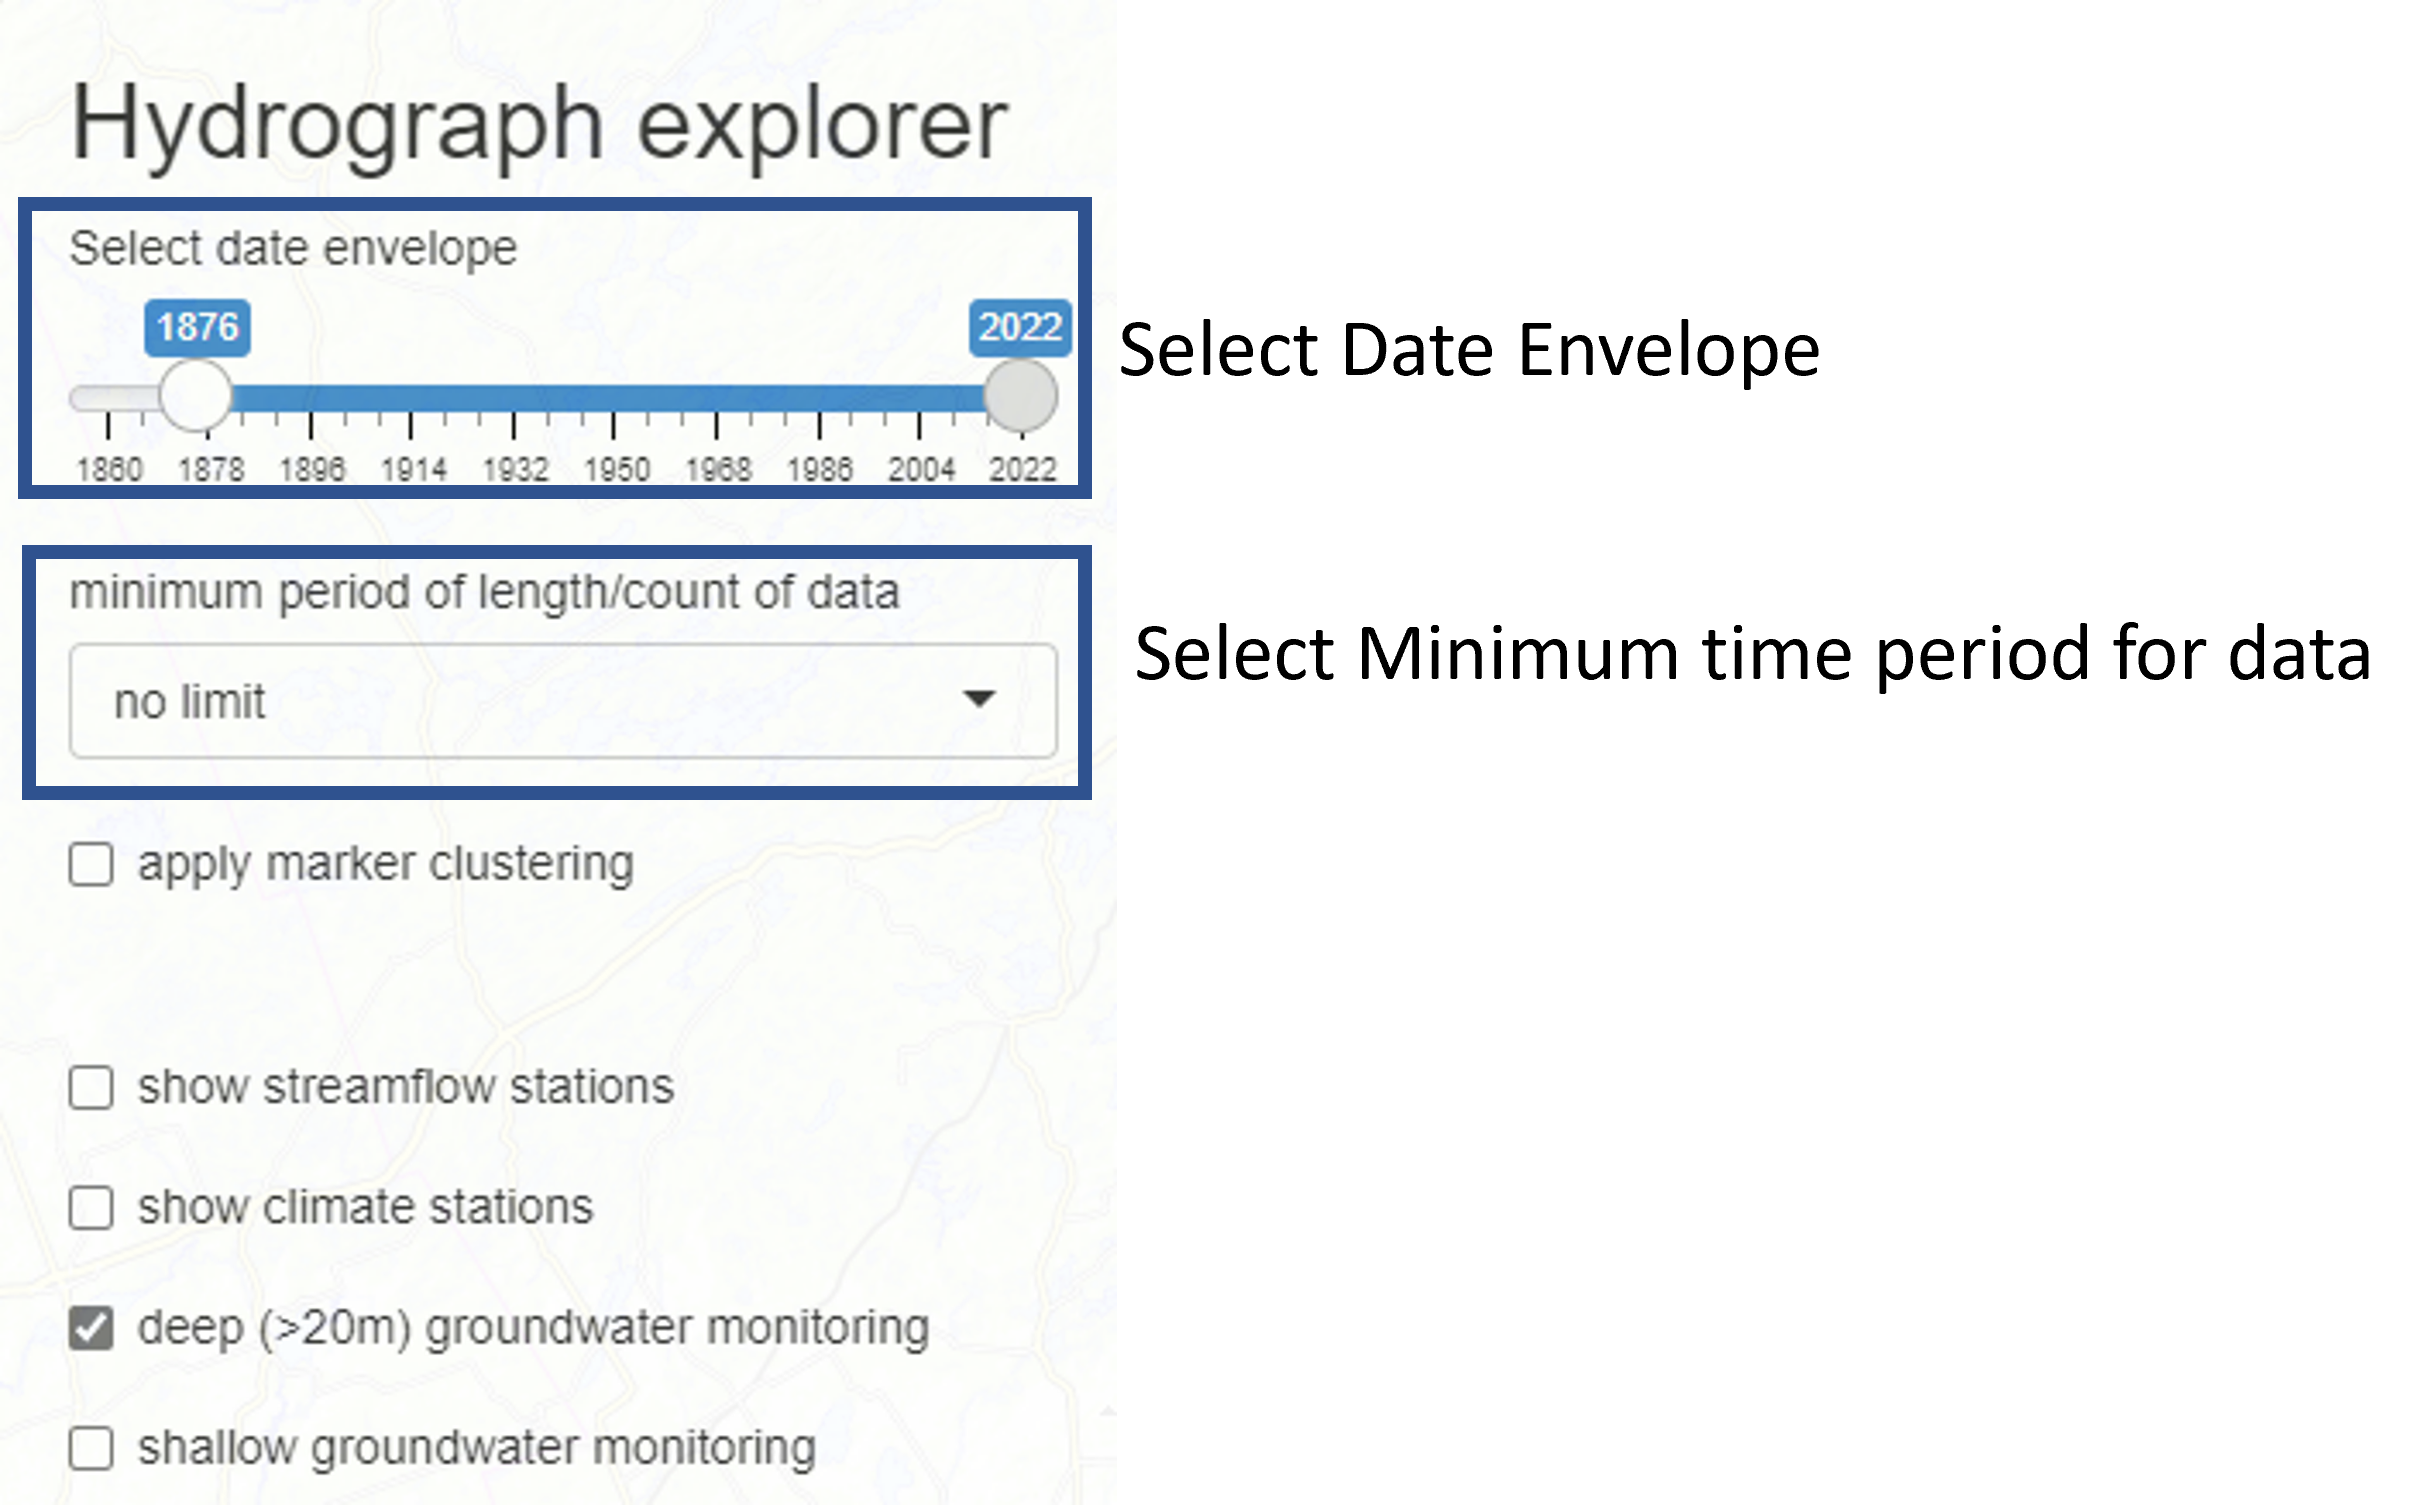
Figure 2: ORMGP Hydrograph Explorer - Selecting Dates
Selecting Location Type
The menu on the right side also shows the types of locations that are available. Four data options are available:
- Streamflow stations
- Climate stations
- Deep (>20 m) groundwater monitoring locations
- Shallow groundwater monitoring locations
By default, streamflow monitoring data for the period 1992—2022 are shown. The four data types listed above can be shown alone or combined.
On the map, the user can zoom in to focus on a specific geographical area using the roller on the mouse, or by clicking the + icon in the upper left corner of the map. Location names are shown when the user uses the mouse to hover over a specific location.
Opening the Hydrographs
Clicking on a location will provide the full location name, plus an option to analyze monitoring data, as shown in Figure 3. Once a location is selected, a preview of the hydrograph for the selected location of the menu on the right.
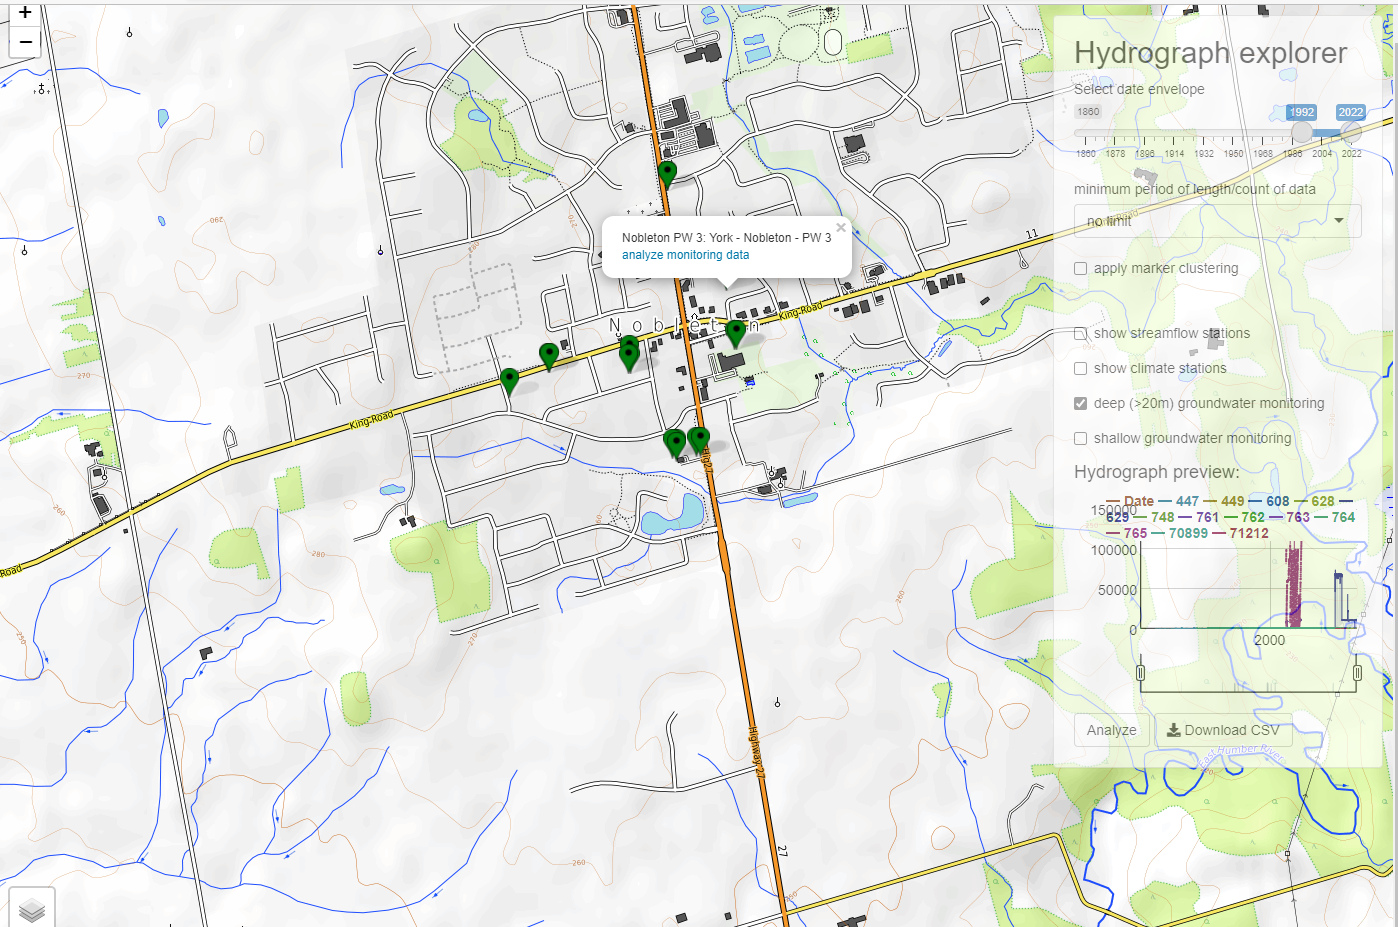
Figure 3: ORMGP Hydrograph Explorer - Selection of a location
Once a location is selected and the user clicks analyze monitoring data, a new web-browser tab will open with graphs and details of the selected location as shown in Figure 4.
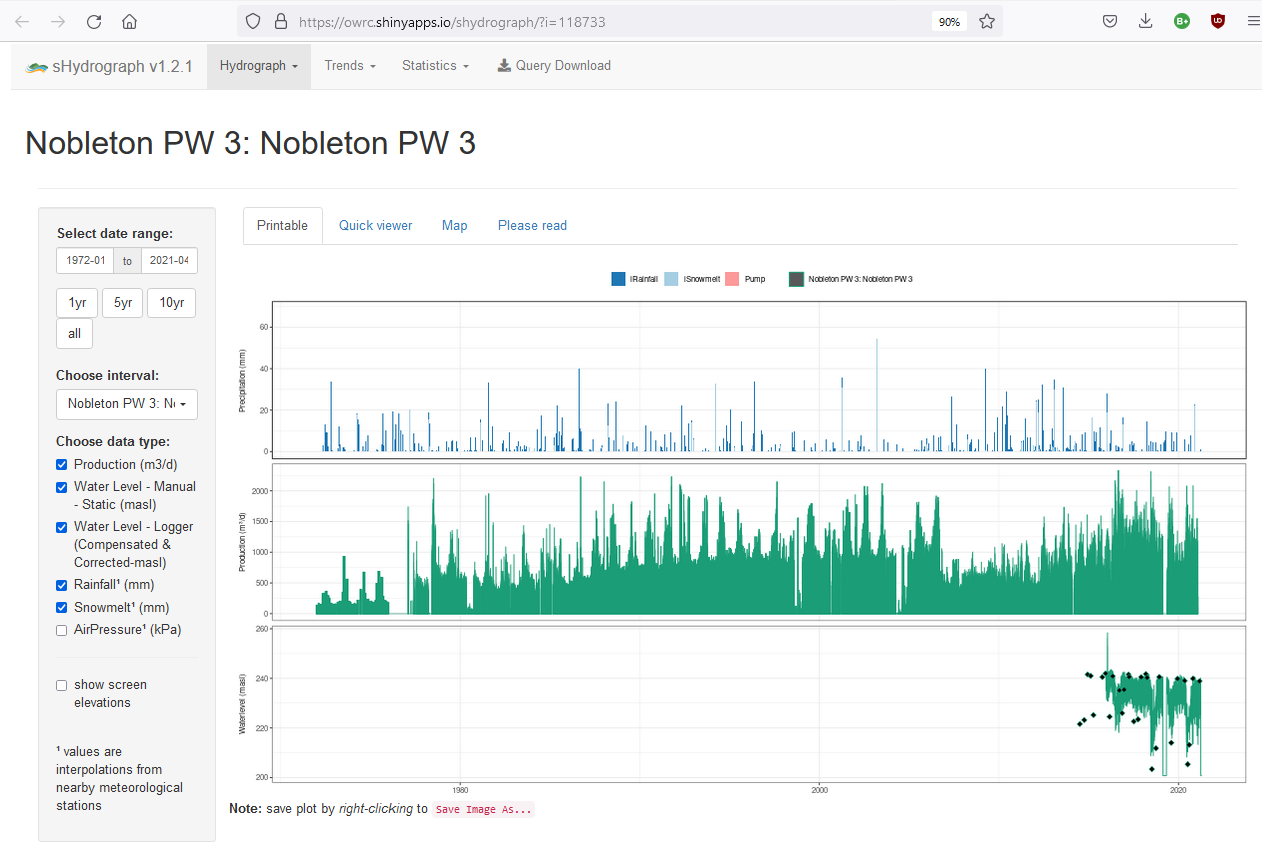
Figure 4: ORMGP Hydrograph Tools
In the sHydrograph browser window, one or more X-Y graphs will be shown, depending on what data is available for the selected location. For this example (Nobleton PW 3), three graphs are shown:
- Precipitation (rainfall and snowmelt interpolated to the well location)
- Production (in this case, PW 3 represents a pumping well)
- Water levels (both static (point data) and logger (line data) are shown) The data shown in these graphs can be toggled off or on using the check boxes on the left menu.
For these hydrographs, precipitation (rainfall and snowmelt) and air pressure data are interpolated from nearby meteorological stations. The remaining data (pumping rates/production and water levels) are from the ORMGP database.