Hydraulic Properties
The ORMGP is actively compiling hydrogeologic parameter estimates (e.g., porosity, specific capacity, storativity, transmissivity, hydraulic conductivity) into the program’s database for the various hydrostratigraphic units interpreted for the study area. The various hydrostratigraphic units and their classification into aquifers and aquifers is hown on Figure 1. To date, activities have focussed on collation of hydraulic conductivity (K) and specific capacity (SC) estimates. Further information on the use of water well specific capacity tests to estimate transmissivity and hydraulic conductivity can be found in Theis et al. (1963), Walton (1970), Bradbury and Rothschild (1985), Domenico and Schwartz (1990), Richard et al. (2016), and Priebe et al. (2018). For the ORMGP study area, the specific capacity estimates are being extended into estimates of transmissivity (T) and hydraulic conductivity (K) utilizing the methodology of Bradbury and Rothschild (1985). Further information on methodology is included in the program’s database manual. Current estimates within the database are as follows:
- K - estimates of hydraulic conductivity (K) from slug tests on piezometers/wells (Units = m/s). Locations with K estimates from slug test analysis are shown on Figure 2;
- Specific Capacity (SC) - specific capacity (pumping rate/maximum drawdown) estimates from data obtained during short-term pumping tests (<4 hours) conducted by well drillers following well installation (Units = L/minute/m). Locations with specific capacity (SC) estimates are shown on Figure 3. The cumulative probability plot of the data is shown on Figure 4;
- TSC - Transmissivity (T) estimates derived from specific capacity (SC) estimates according to the methodology of Bradbury and Rothschild (1985) which allows for corrections for partial penetration of well screen and incorporates estimates of the full formation thickness at each well (Units = m²/s; Figure 4). Formation thickness is determined from the latest ORMGP geologic model;
- KSC - estimates of hydraulic conductivity (K) derived from specific capacity (SC) estimates utilizing methodology of Bradbury and Rothschild (1985). Cumulative probability plot of the data shown on Figure 5 (Units = m/s). Formation thickness is determined from the latest ORMGP geologic model;
- TSC_SCR - estimates of Transmissivity (T) derived from specific capacity (SC) estimates utilizing the methodology of Bradbury and Rothschild (1985). In this case the formation thickness is taken as the screen (SCR) length (Units = m²/s; Figure 4); and
- KSC_SCR - estimates of hydraulic conductivity (K) derived from specific capacity (SC) estimates (Figure 5) utilizing methodology of Bradbury and Rothschild (1985). Similarly to above the formation thickness is taken as the screen (SCR) length (Units = m/s).
A summary of all the current hydraulic conductivity estimates within the ORMGP database is included in Figure 6 and Table 1. Regular testing and refinement of the conceptual model, particularly the 3D geologic interpretation and by extension well screen geologic formation assignment, is being conducted by ORMGP staff. This testing and refinement includes data mining of hydraulic paramater estimates included within the program’s library of documents.
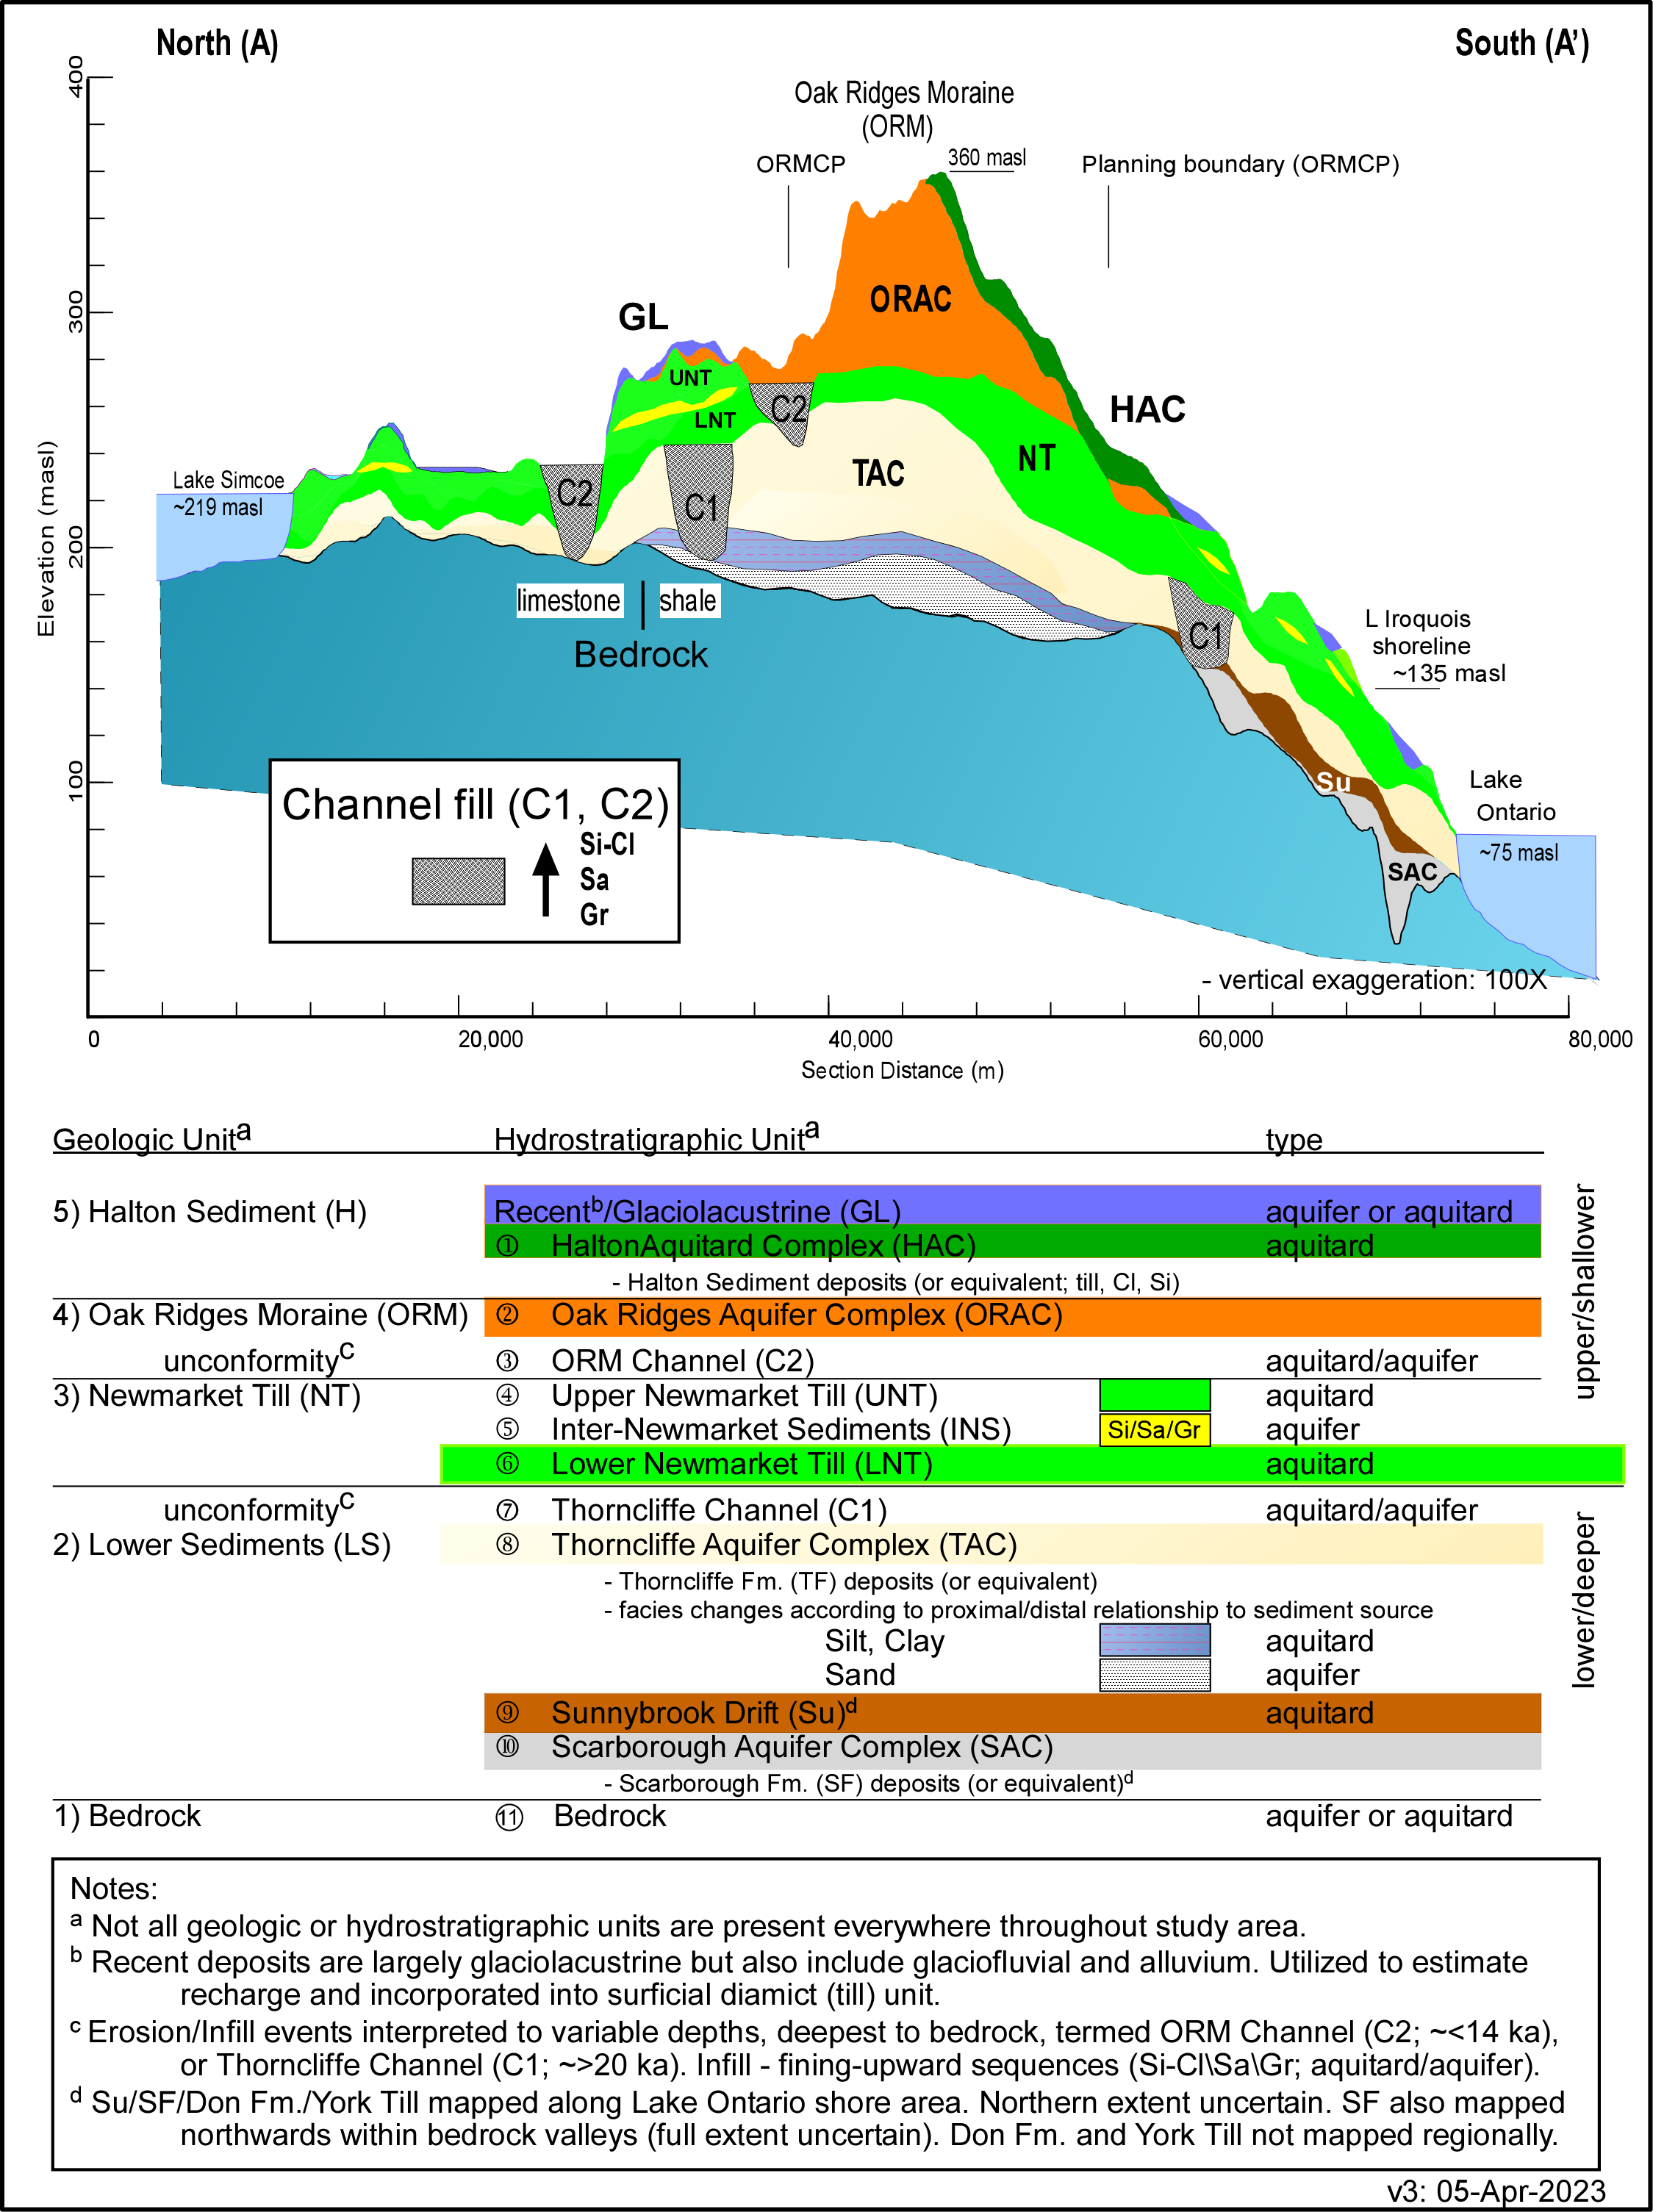
Figure 1: Summary of hydrostratigraphic units within the study area. Quaternary sediments present within the study area represent an alternating glacial-interglacial assemblage with major glaciations occurring approximately 190-135 ka (Illinoian) and 30-10 ka (Late Wisconsinan; Barnett, 1992). Use of the term “complex” denotes variable facies and, by extension, variable hydrogeologic properties within a hydrostratigraphic unit. Use of the term “or equivalent” refers to similar materials and hydraulic properties leading to the possibility of being of hydrostratigraphic (flow property) equivalence.
Interactive maps
Please note that each map below takes around minute to load, so please be patient; there are >150,000 locations found with specific capacity being rendered.
Hint: full-screen available in the top-left corner
Figure 2: Map of hydraulic conductivity (K) estimates within the ORMGP information and analysis system. (be patient)
Figure 3: Map of specific capacity (SC) estimates within the ORMGP information and analysis system. (be patient)
Cumulative Probability plots
Hint: right-click to copy as image
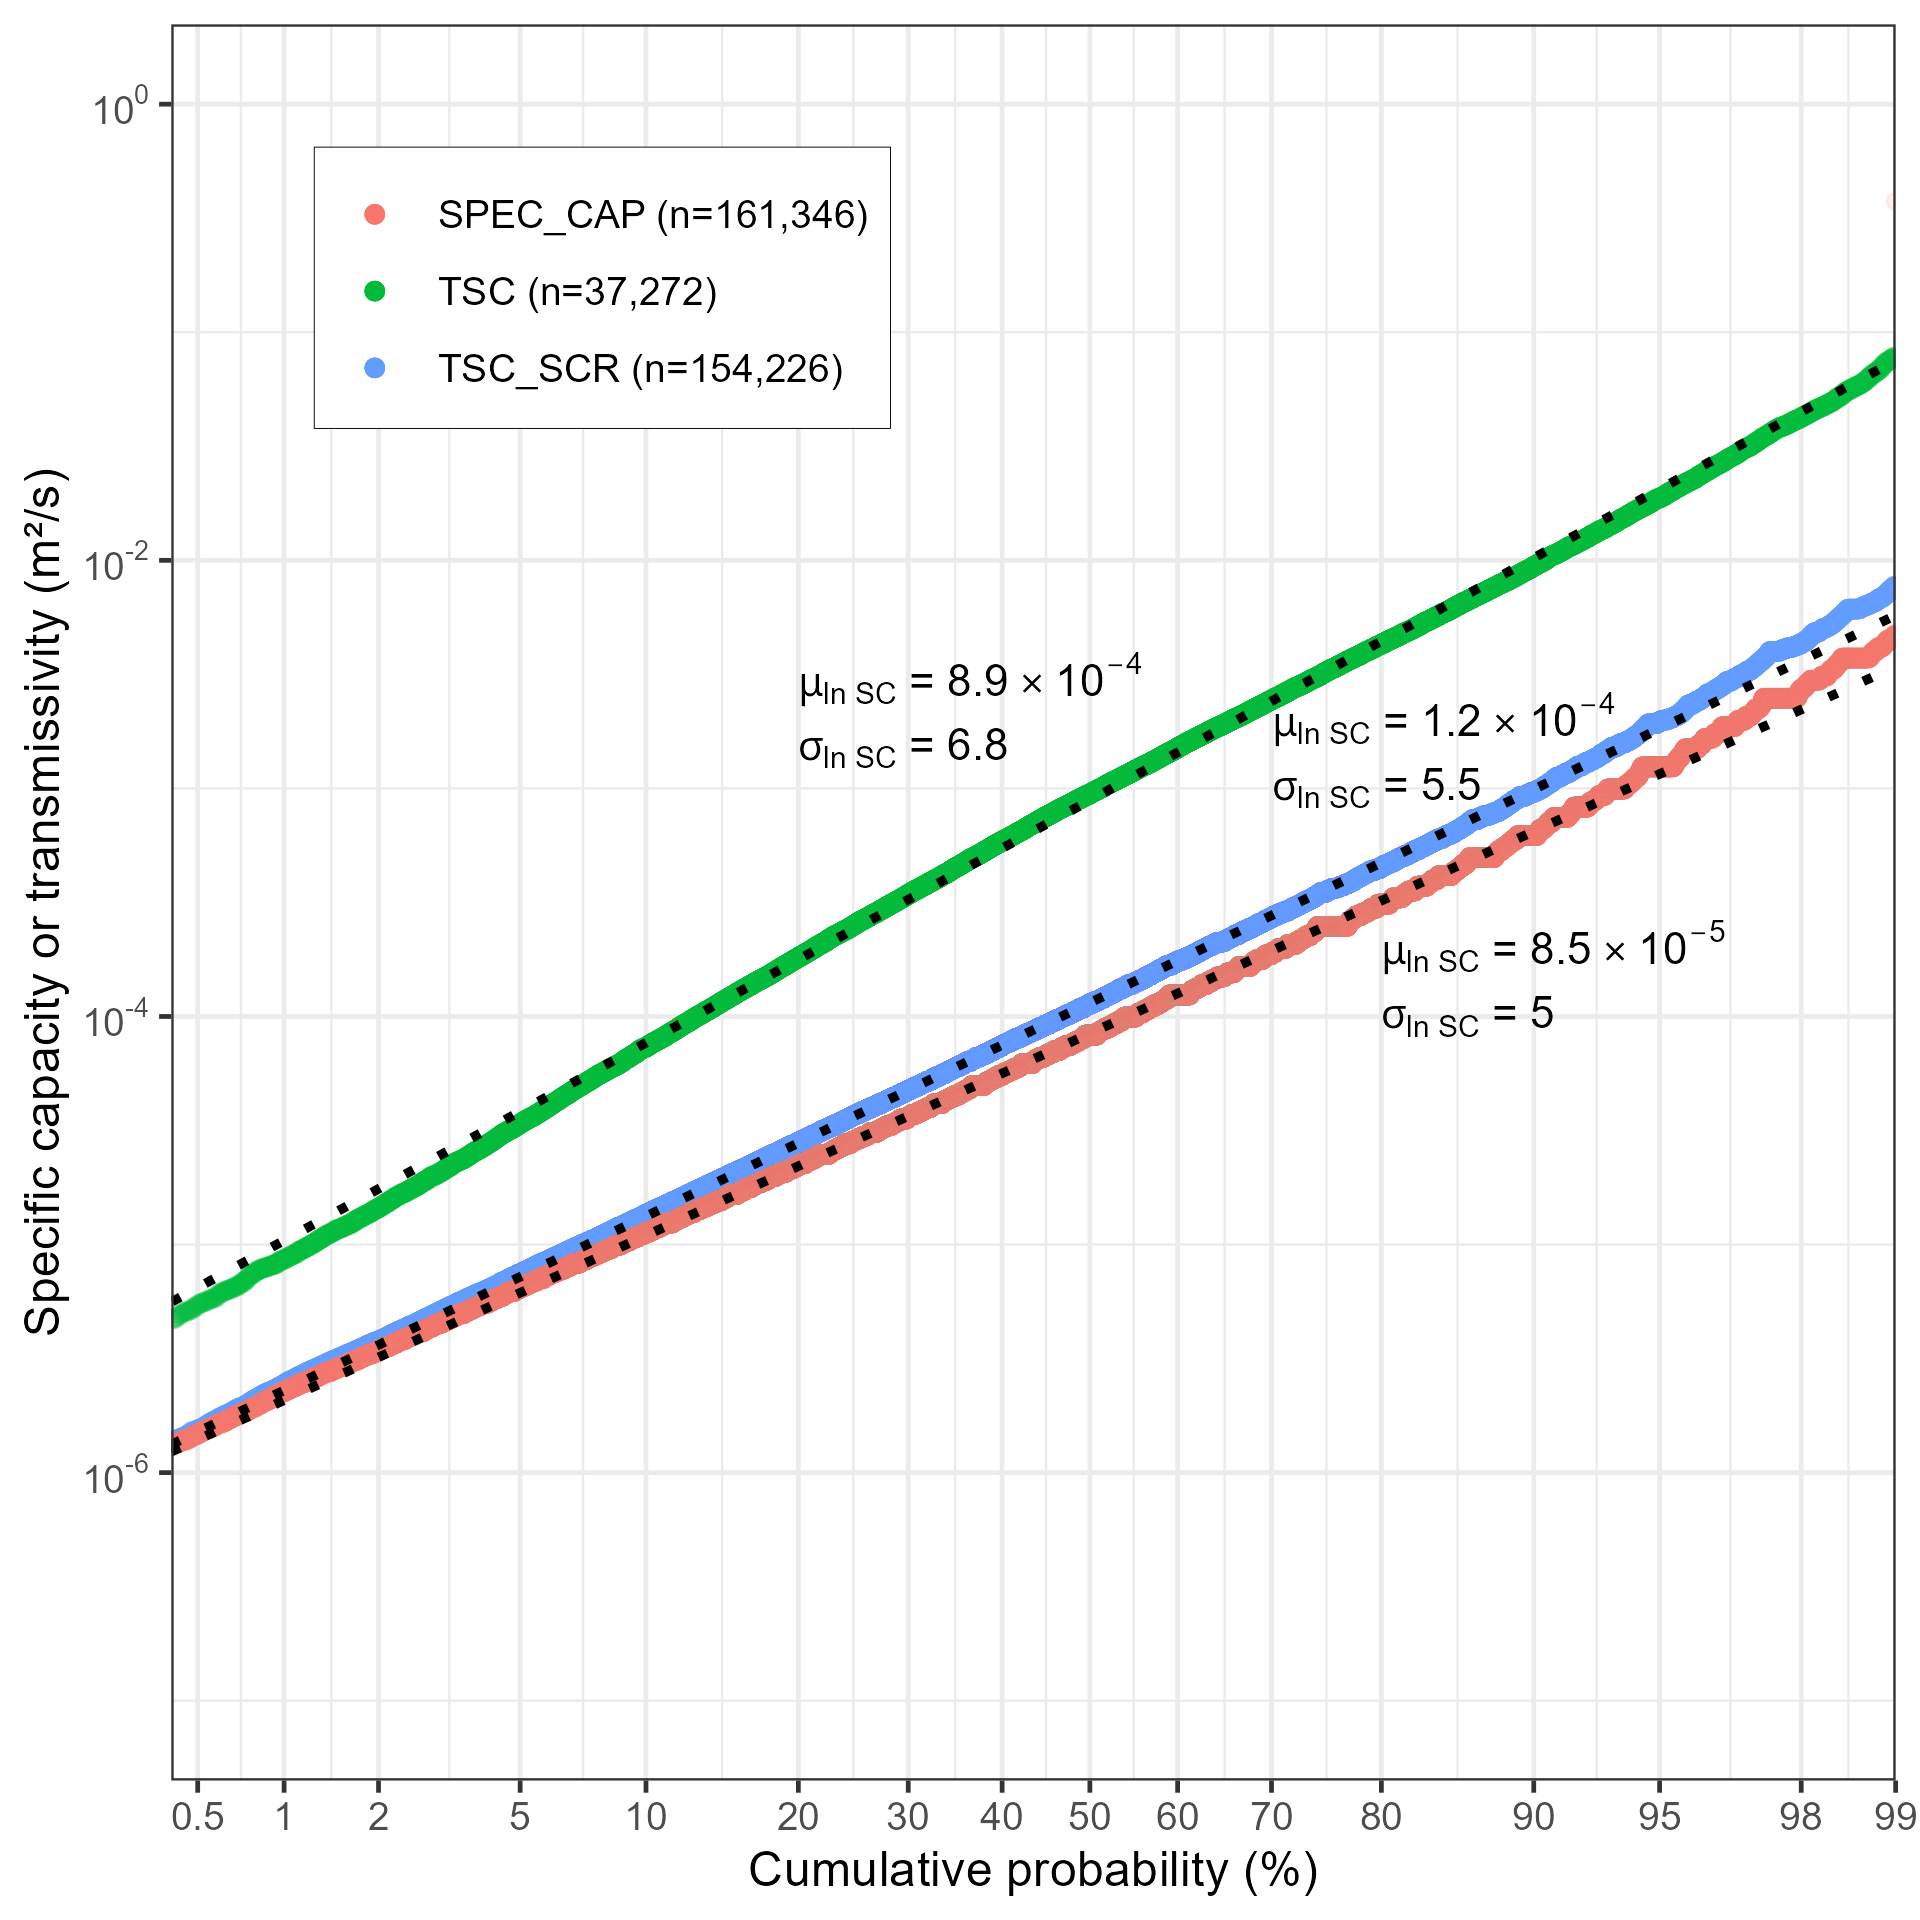
Figure 4: Cumulative probability plot showing specific capacity (SPEC_CAP), TSC, and TSC_SCR (m²/s). The geometric mean (cumulative probability = 50%) TSC value is approximately an order of magnitude greater than the geometric mean specific capacity (SPEC_CAP) estimates. For these (TSC) estimates the full interpreted formation thicknss is utilized in the calculations. Utilizing the screen length as the formation thickness (TSC_SCR), which is generally shorter than the interpreted formation thickness, leads to derived TSC_SCR values closer to SPEC_CAP estimates with a geometric mean of ~1E-4 m²/s. This is likely due to heterogeneity within study area formations, particularly in the vertical direction (Cooper et al., 1967) where effective aquifer thickness is smaller than the interpreted formation thickness. Heterogeneity within the various hydrostratigraphic units has led to the use of the term ‘complex’ when describing study area aquifer and aquitard complexes (e.g., Thorncliffe aquifer complex).
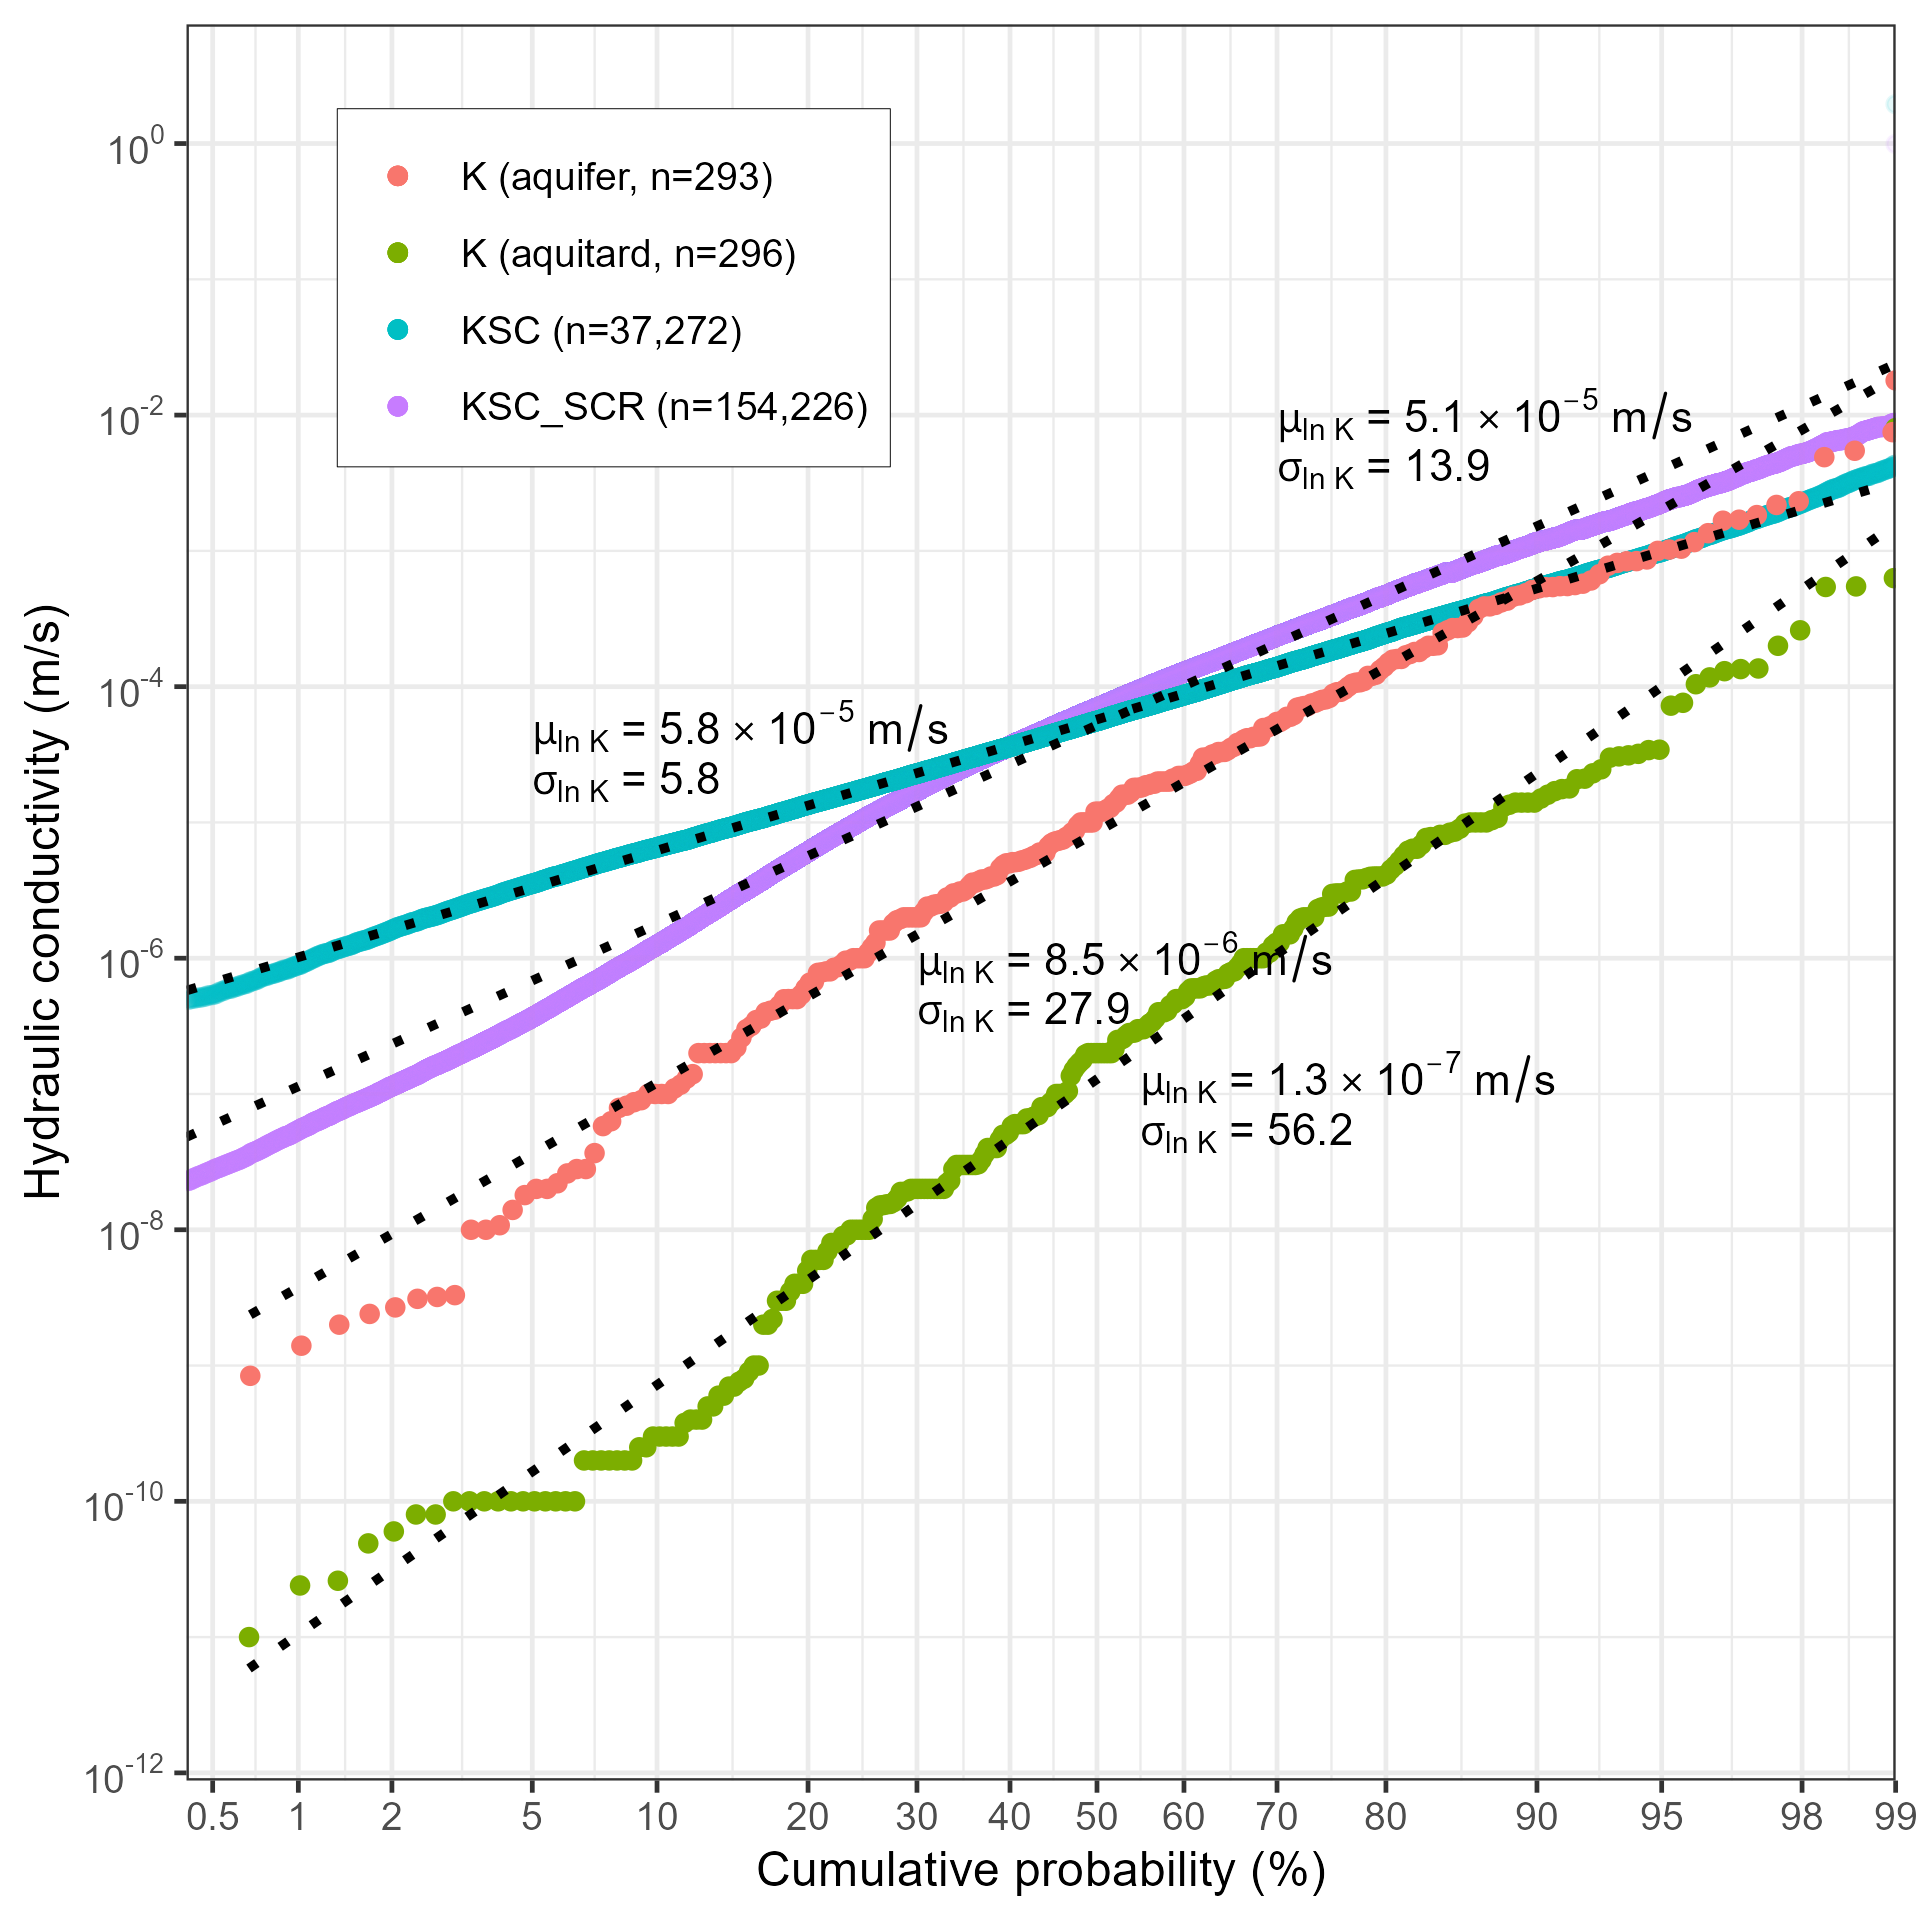
Figure 5: Cumulative probability plot showing K (slug tests), KSC and KSC_SCR (m/s). Note that Ksc from specific capacity estimates are generally higher than K estimates from slug tests. This is not surprising given that drillers choose to screen the most permeable interval within an aquifer complex in order to maximize well yield. Hydraulic conductivity estimates from short term pumping tests (<4 hours) will sample a larger aquifer volume than a slug test so therefore have a higher likelihood of accessing higher K sediment if there is heterogeneity, which is typical in glaciated environments.
Distributions
Hint: right-click to copy as image
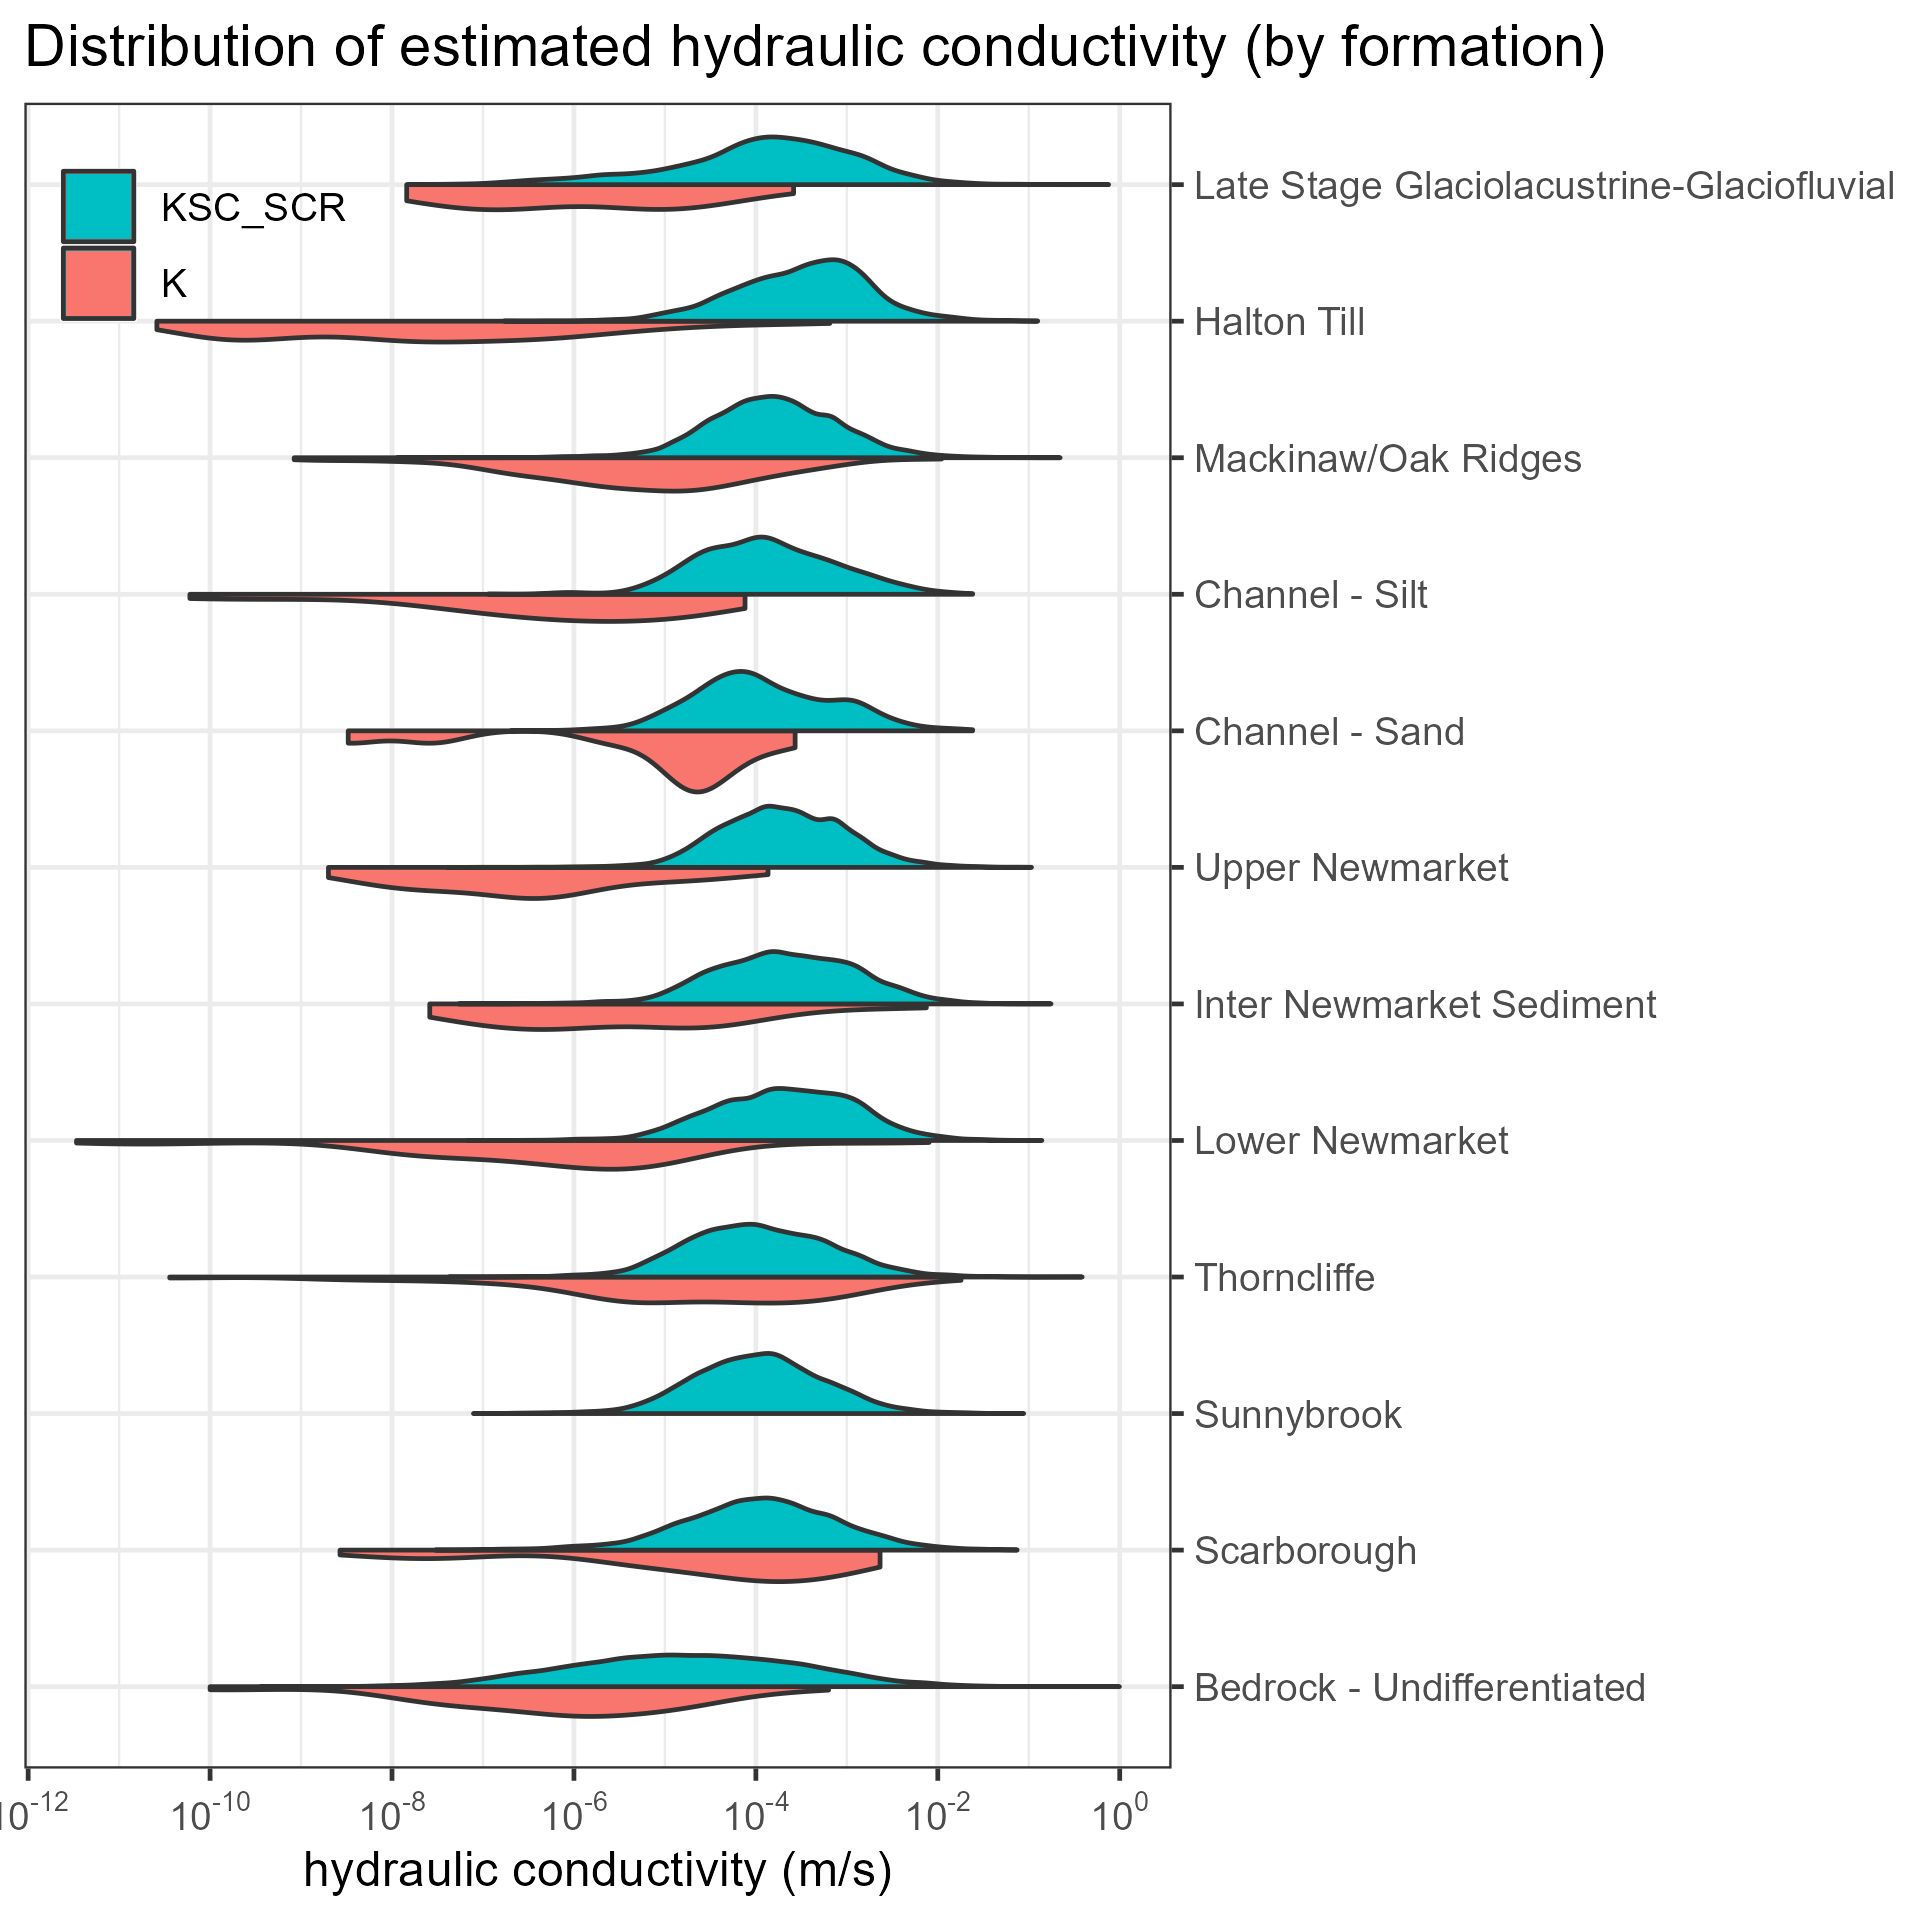
Figure 6: Distribution of hydraulic conductivity (m/s) by formation. Upper distribution (KSC_SCR) is hydraulic conductivity estimate from specific capacity utilizing the screen length as the aquifer thickness. The lower distribution (K) is hydraulic conductivity estimates from slug testing. Note that many of the KSC_SCR estimates in the figure apply to aquitard formations (e.g., Lower Newmarket Till). The ORMGP classifies screens according to formation by comparing screen elevation to the latest geologic model interpretation. KSC_SCR estimates for aquitard formations are treated as part of the program’s QA/QC process which includes testing the 3D geologic unit interpretation. Specific capacity estimates are from water well testing at the time of well completion. While heterogeneities exist within study area aquitards, it is considered low probability that domestic water wells will be installed within aquitards. Areas with KSC_SCR estimates for aquitard formations are subject to further inspection and refinement of the 3D geologic/hydrostratigraphic unit interpretation where necessary. Estimates of hydraulic conductivity from specific capacity (KSC_SCR) for bedrock aquifers compare favourably to similar methodology estimates for carbonate aquifers along and west of the Niagara Escarpment where geometric mean hydraulic conductivity ranges from 3E-5 to 1E-4 m/s reported in Priebe et al. (2018).
Table 1: Summary distribution statistics of hydraulic conductivity (m/s).
| Formation | estimate | n | mean | geomean | median |
|---|---|---|---|---|---|
| Late Stage Glaciolacustrine-Glaciofluvial | K | 14 | 2.5E-05 | 1.2E-06 | 2.1E-06 |
| KSC_SCR | 3,417 | 1.1E-03 | 1.2E-04 | 1.5E-04 | |
| Halton Till | K | 106 | 1.5E-05 | 2.4E-08 | 2.0E-08 |
| KSC_SCR | 1,446 | 1.2E-03 | 3.2E-04 | 3.7E-04 | |
| Mackinaw/Oak Ridges | K | 152 | 1.7E-04 | 5.4E-06 | 6.7E-06 |
| KSC_SCR | 13,942 | 6.6E-04 | 1.6E-04 | 1.5E-04 | |
| Channel - Silt | K | 18 | 9.5E-06 | 5.7E-07 | 1.1E-06 |
| KSC_SCR | 873 | 5.7E-04 | 1.3E-04 | 1.2E-04 | |
| Channel - Sand | K | 10 | 4.7E-05 | 5.5E-06 | 1.9E-05 |
| KSC_SCR | 1,389 | 6.0E-04 | 1.2E-04 | 9.9E-05 | |
| Upper Newmarket | K | 19 | 1.0E-05 | 3.3E-07 | 3.4E-07 |
| KSC_SCR | 13,734 | 7.5E-04 | 2.0E-04 | 1.9E-04 | |
| Inter Newmarket Sediment | K | 21 | 4.0E-04 | 3.5E-06 | 1.0E-06 |
| KSC_SCR | 6,111 | 9.7E-04 | 2.1E-04 | 2.1E-04 | |
| Lower Newmarket | K | 61 | 1.8E-04 | 4.4E-07 | 7.7E-07 |
| KSC_SCR | 11,657 | 8.8E-04 | 2.1E-04 | 2.2E-04 | |
| Thorncliffe | K | 79 | 6.0E-04 | 1.8E-05 | 3.3E-05 |
| KSC_SCR | 10,254 | 6.4E-04 | 1.1E-04 | 1.0E-04 | |
| Sunnybrook | K | 1 | 9.1E-07 | 9.1E-07 | 9.1E-07 |
| KSC_SCR | 6,971 | 4.6E-04 | 1.1E-04 | 1.1E-04 | |
| Scarborough | K | 31 | 3.5E-04 | 2.4E-05 | 9.2E-05 |
| KSC_SCR | 6,928 | 6.9E-04 | 1.1E-04 | 1.2E-04 | |
| Bedrock - Undifferentiated | K | 53 | 2.2E-05 | 7.1E-07 | 1.0E-06 |
| KSC_SCR | 77,114 | 5.3E-04 | 1.7E-05 | 1.7E-05 |
References
Barnett, P.J. (1992). 21. Quaternary Geology of Ontario. In Thurston, P.C., Williams, H.R., Sutcliffe, R.H., & Stott, G.M. (Eds.), Geology of Ontario, Ontario Geological Survey, Ontario Ministry of Northern Development and Mines, Special Volume 4, Part 2, Chapter 21, 1011–1088.
Bradbury, K.R., and Rothschild, E.R. 1985. A computerized technique for estimating the hydraulic conductivity of aquifers from specific capacity data. Ground Water, 23(2), 240-246.
Copper, H.H., Jr., Bredehoeft, J.D., and Papadopulos, I.S. 1967. Response of a finite diameter well to an instantaneous charge of water. Water Resources Research, 3(1), 263-269.
Domenico, P.A., and Schwartz, F.W. 1990. Physical and Chemical Hydrogeology. John Wley & Sons, Inc., 824p.
Priebe, E.H., Neville, C.J., and Rudolph, D.L. 2018. Enhancing the spatial coverage of a regional high-quality hydraulic conductivity dataset with estimates made from domestic water-well specific-capacity tests. Hydrogeology Journal, 26, 395-405.
Richard, S.K., Chesnaux, R., Rouleau, A., and Coupe, R.H. 2015. Estimating the reliability of aquifer transmissivity obtained from specific capacity tests: examples from the Saguenay-Lac-Saint-Jean aquifers, Canada. Hydrological Sciences Journal, 61(1), 173-185.
Theis, C.V., Brown, R.H., and Meyer, R.R. 1963. Estimating the transmissivity of aquifers from the specific capacity of wells. In R. Bental (compiler), Methods of determining permeability, transmissivity, and drawdown. U.S. Geological Survey Water-Supply Paper 1536-I, p331-341.
Walton, W.C. 1970. Groundwater Resource Evaluation. McGraw-Hill Book Company. 664p.
last commit 2024-05-02