Water Table Fact Sheet
Introduction
The Oak Ridges Moraine Groundwater Program (ORMGP) has been working on producing a reliable water table map for quite some time. Over the years several versions of the water table surface have been prepared as new information has become available or as the technical mapping methodology has been adjusted. Although it sounds straightforward to interpolate a water table surface, there are a number of factors that make the process difficult. Here we outline some of the considerations that have gone into creating the water table surfaces (and their derivatives) and can serve as a supplementary document for those that make use of these layers.
There are many factors to be considered in preparing a water table surface:
- Are there perched water table conditions across broad areas that might result in a water table delineation that is too high?
- How shallow/deep should wells be for the measured static water level to be incorporated into the interpolated water table surface?
- Are there artesian or high pressure confined aquifers at depth where static water levels would result in erroneous water table mapping? Do streams and waterbodies within the ORMGP area reflect the water table surface?
In taking such questions into account, it has been put forward that, wells having a screened depth of 20 metres below ground surface (mbgs) or less would provide a reasonable reflection of water table conditions across the broad geographic area encompassed by the ORMGP. Over the years, this has been confirmed through comparison to water table elevations derived from numerical models.
The static water level measurements obtained from the shallow wells (less than 20 m bgs) in the ORMGP database reflect measurements from water wells and/or boreholes drilled between approximately the 1940s and current day. These wells could have been drilled in either wet or dry years/seasons, and therefore, aggregating these measurements to derive a water table map, can yield a surface that reflects ‘temporal average conditions’, at best. Depending upon the hydrogeologic setting, the water table elevation/depth has been observed to vary seasonally from ±1 to ±10 m in the ORMGP area, and therefore higher or lower observations than what is presented on the ORMGP website should be expected. All surfaces have been interpolated to a 100 m x 100 m grid, projected to NAD83 UTM Zone 17.
Level 0 (WT0)
Interpolation of shallow well static water levels and correction to ground surface (data-driven)
The water table map derived using data from shallow wells (less than 20 m deep) will reflect the water table; however, in places, the interpolated water table surface is observed to exceed ground surface, most notably in areas of deeper river valleys where there is insufficient well coverage to bring the water table down to the valley bottoms. The water table is corrected by limiting its elevation to 0.5 m below the ground surface. The final water table map produced in this way is named the “Level 0” Water Table (data-driven, referred to as WT0; Figure 1) and is available on the ORMGP web mapping portal.

Figure 1: Level 0 Water Table (WT0)
Areas where the interpolated water table surface is above ground, might reflect conditions where groundwater is actively discharging into river valley systems. An accompanying map named Potential Discharge Areas (PDAs; Figure 2) is created to identify those areas where the initially interpolated water table surface (prior to constraining the surface to ground elevation minus 0.5 m) was above ground. These areas might reflect important groundwater dependent habitat areas where cold groundwater discharges to the stream network. For instance, a review of cold-water fisheries mapping suggests a coincidence of observed cold water streams and the mapped PDAs.
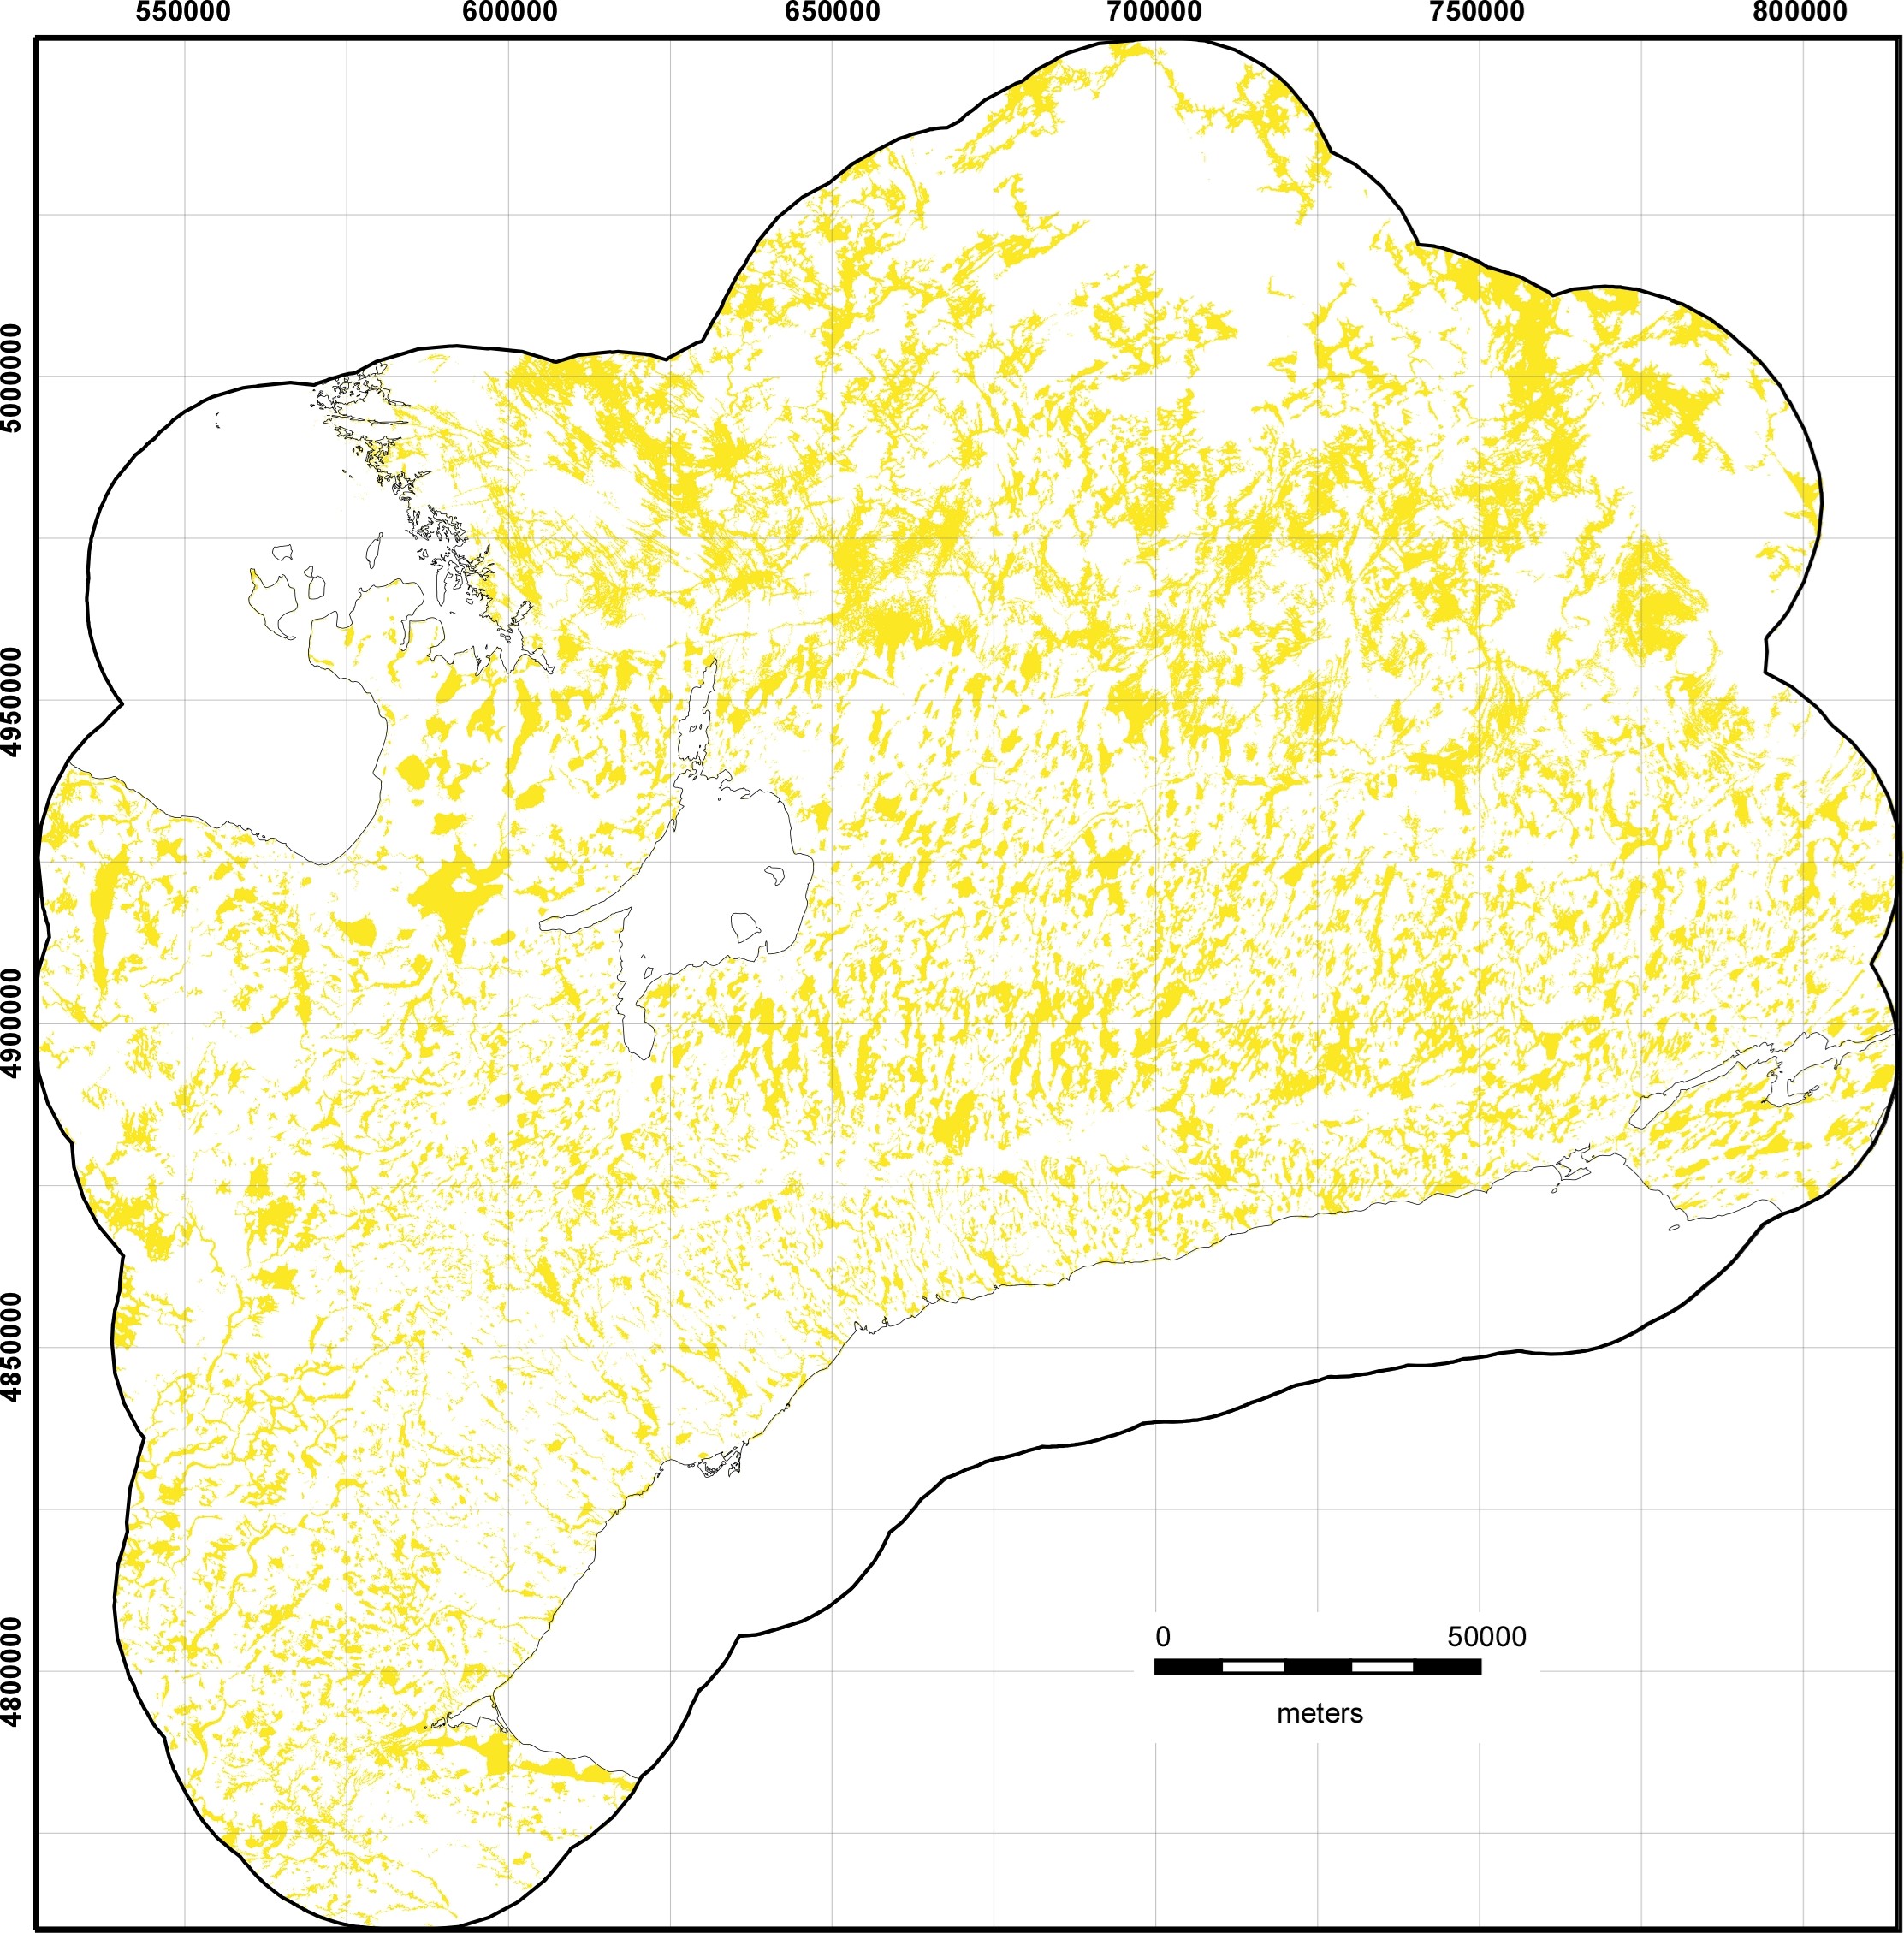
Figure 2: Potential Discharge Areas (WT0-PDA) as derived from the WT0 surface.
A derivative of the WT0, the “Depth to WT0” layer, reflects the difference between the Ground Surface DEM and the WT0, is also available on the ORMGP web mapping portal.
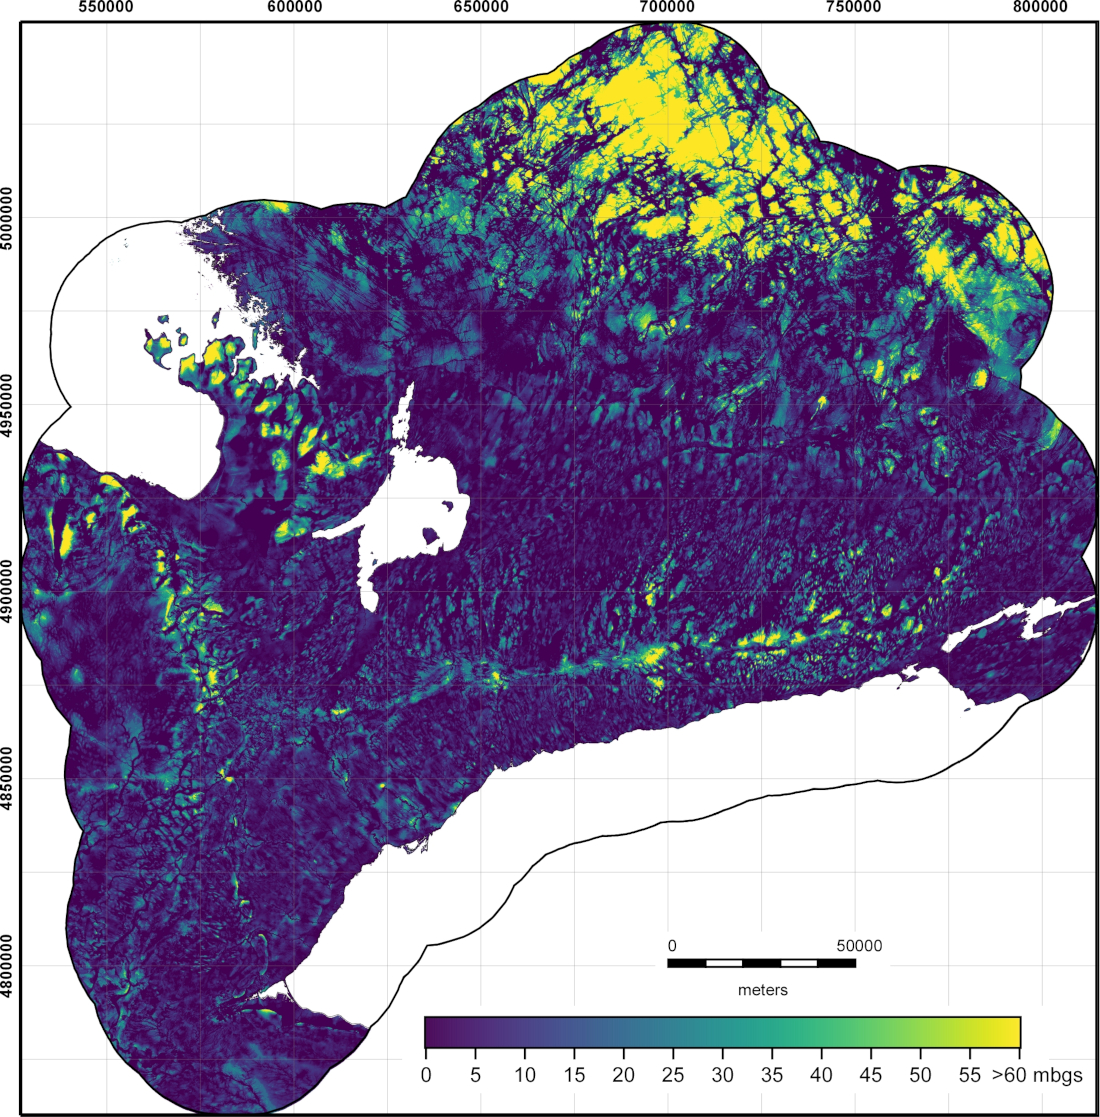
Figure 3: Depth to Water Table (WT0-DEPTH)
Level 1 (WT1)
Level 0 Plus Added Corrections
Closer examination of the WT0 suggested that there might be ways that the map could be improved using expert knowledge and additional data sources. With the corrections incorporated, the map is named Water Table Level 1 (WT1). Corrections made to WT0 include:
Incorporation of Streams
Given the interconnectedness of the groundwater and surface water systems across the ORMGP area, as evidenced by the prevalence of perennial streams, it is postulated that, as groundwater discharges to streams, the streams reflect the elevation of the water table. By distributing “stream nodes” at an approximate 500 m spacing along mapped watercourses, elevations are collected as surrogate water table points allowing for the interpolated water table to be constrained in river valleys.
By constraining the water table to all mapped streams, the water table was observed rise to unreasonable elevations. This was especially the case around lower order streams in upland areas of higher permeability sandy or granular soils like the Oak Ridges Moraine. Through trial and error, streams of Strahler Class 4 or greater were assigned stream nodes used to constrain the water table.
Additional adjustments were made in the Niagara Escarpment and Canadian Shield regions where the topographic variability resulted in the mapped water table being notably deep below the ground surface. To raise the water table surface, Strahler Class 3 and 2 streams (and higher) were assigned stream nodes for areas west of the brow of the Niagara Escarpment and in areas where the Canadian Shield is exposed at surface.
In some areas of poor well density, the incorporation of stream nodes over-constrained the water table surface between deeper river valleys (e.g. between the Rouge River and Don River valleys), resulting in an unreasonably deep watertable. To minimize this type of over-constraint, a density driven methodology was employed to restrict the use of stream nodes in areas of poor well density-(defined as areas having less than three wells within a 1-kilometre radius of a stream node).
Figure 4 summarizes the above, displaying how streams of different classes were incorporated into the WT1 surface interpolation.
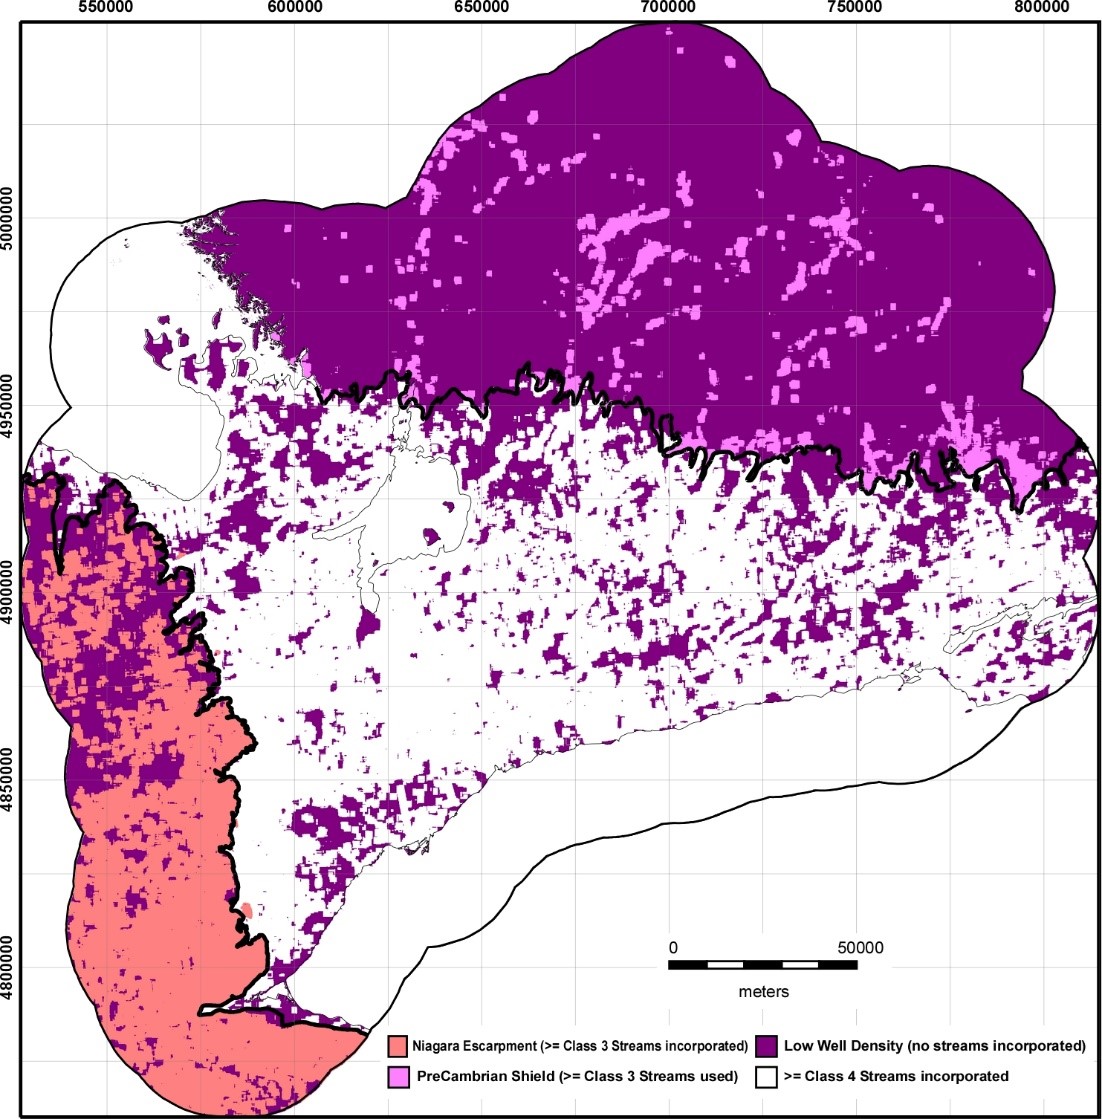
Figure 4: Summary of how different Strahler Stream Classes were incorporated into the WT1 surface.
Intermediate Depth Wells
Beneath the Oak Ridges Moraine and in other upland areas, it was found that the WT0 surface remained shallower than what field measurements indicated (e.g., up to 30 m deep in areas of the Ganaraska Forest in the eastern part of the moraine). The WT0 surface beneath the moraine was being constrained by shallow wells on the south and north flanks of the moraine. With the water table being so deep beneath the moraine, there are no data points (< 20 m deep) available on the moraine itself. The result is a relatively flat, shallow water table surface beneath the moraine. To correct (deepen) the water table surface in these upland areas, wells of “intermediate depth” (< 40 metres) were added as additional water table data points. This methodology is applied all areas where the WT0 was interpolated at a depth of > 20 metres.
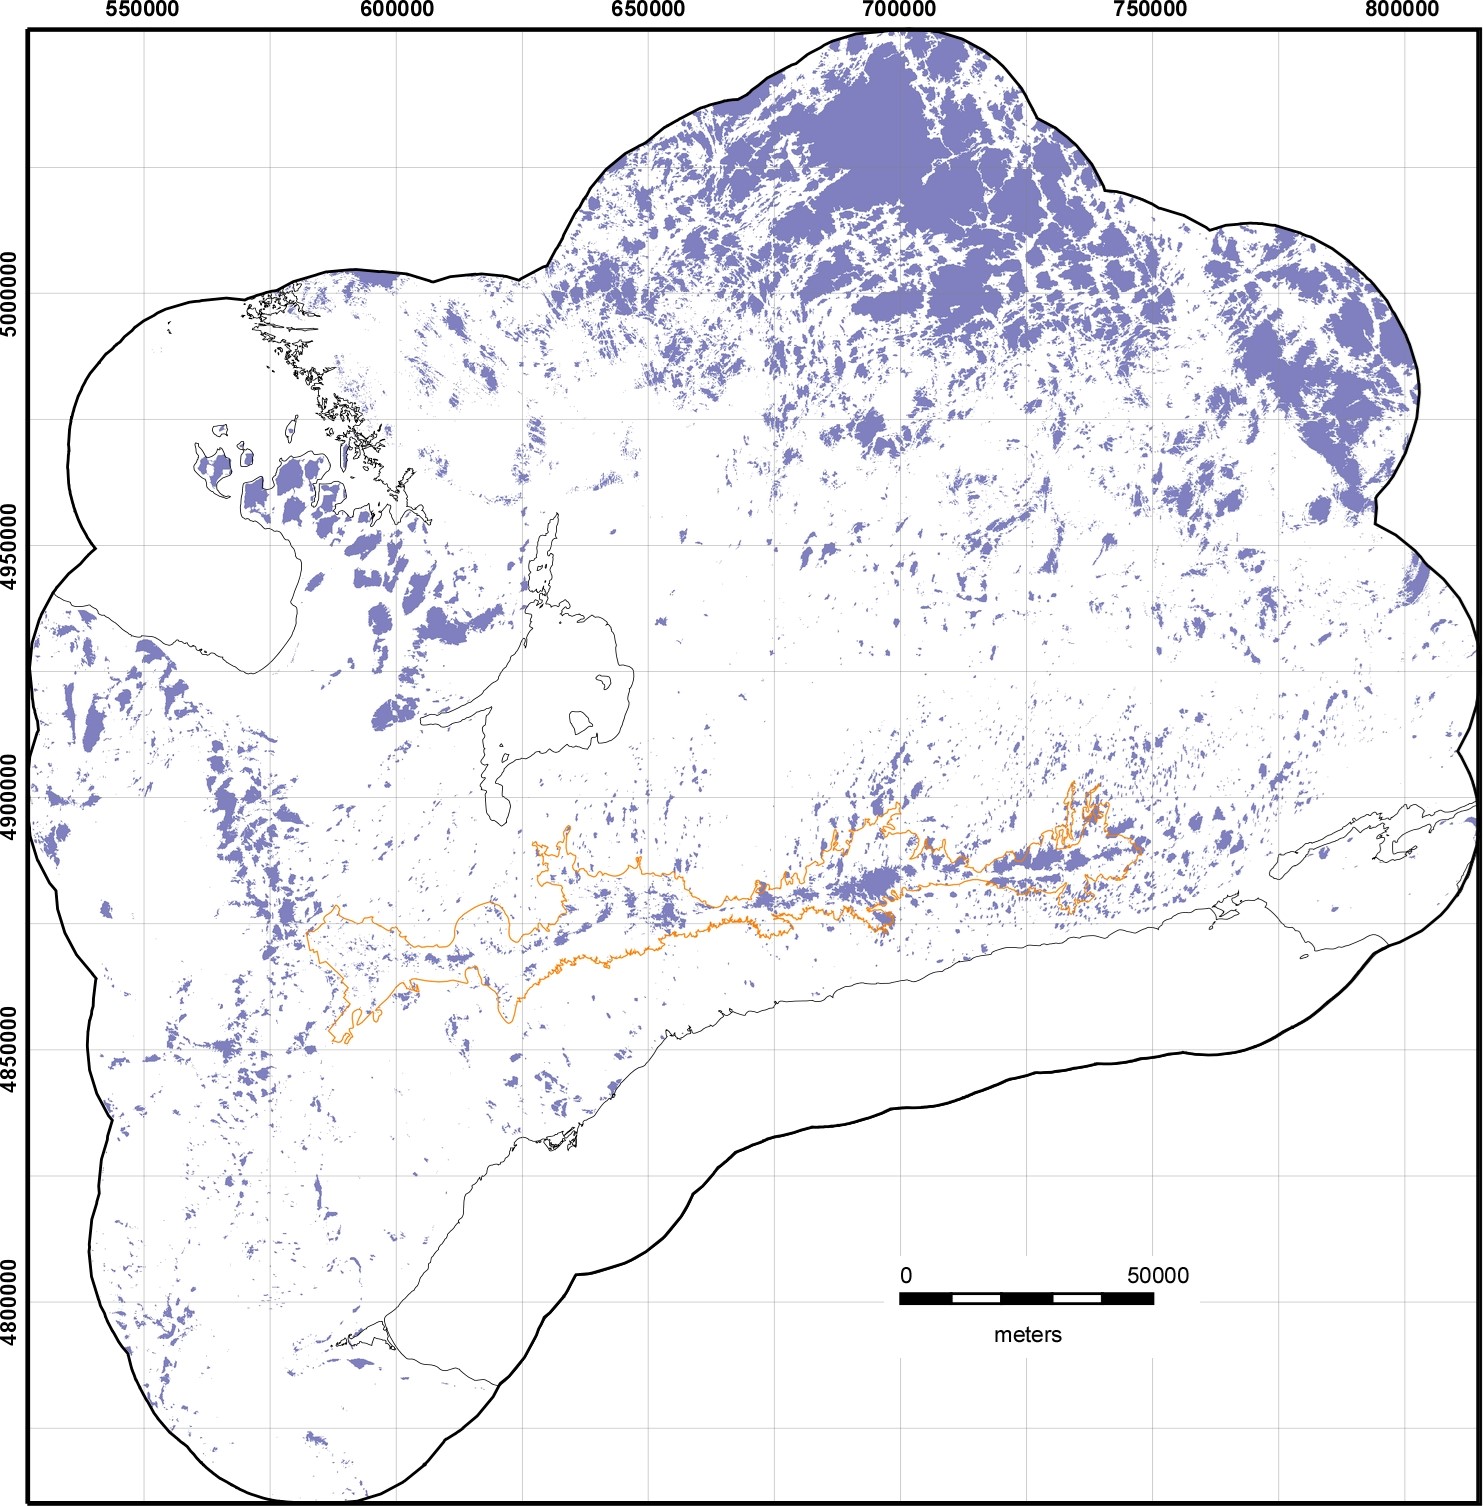
Figure 5: Areas within which wells of moderate depth (i.e., between 20 and 40
mbgs) are incorporated for interpolation. This includes the complete area of
the Oak Ridges Moraine (outlined here in orange). Outside of the Oak Ridges
Moraine, these areas are found to be below 20mbgs on WT0.
The resultant water table surface (the Level 1 surface, WT1), using the Incorporation of Streams and Intermediate Depth Wells methodology is shown in Figure 6.
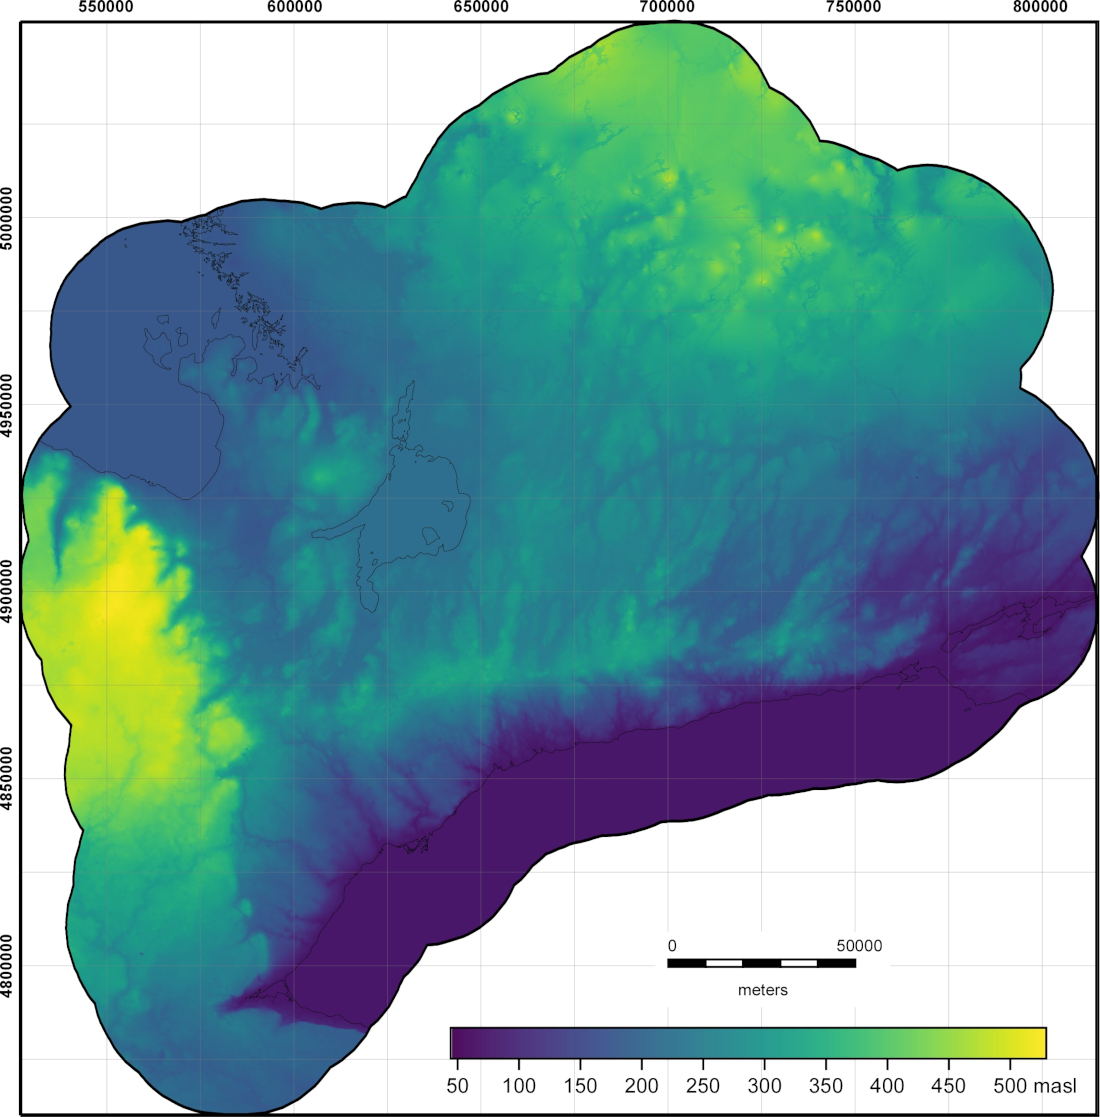
Figure 6: Enhanced Water Table (WT1)
From this, a “Depth to WT1” can be calculated, as seen in Figure 7.

Figure 7: Depth to Water Table (WT1-DEPTH)
Summary: WT0 vs WT1
The ORMGP will maintain and make available on the website, two differing water table surfaces, and in addition, a map showing the difference between the two (Figure 8).
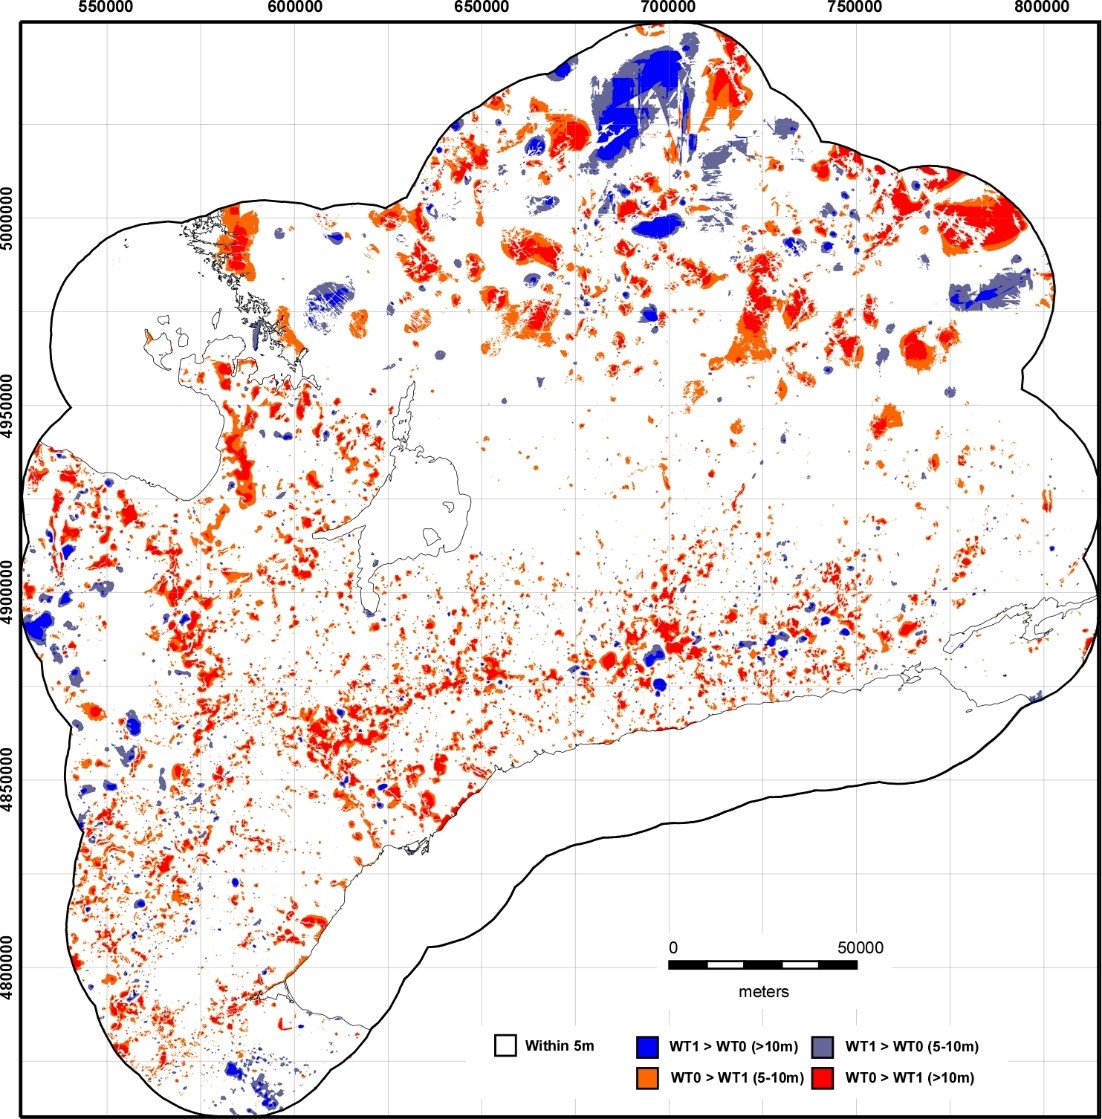
Figure 8: Differences between WT0 and WT1 (WT0 minus WT1).
The Level 0 Water Table (WT0) shows a surface derived from shallow well data and can be considered a direct reflection of observations made at wells. In creating the WT1 surface, ORMGP staff have tried to improve on the WT0 surface. The modifications employed in creating the WT1 surface reflect a reasonable approach to correcting the water table surface and involve professional judgement. We will continually explore additional approaches to better approximate existing groundwater levels in water table and potentiometric surface maps. Users that have ideas for improving the interpolation methodology are encouraged to contact ORMGP staff to offer their input.
Based on their objectives, users are encouraged to explore both layers and choose the most representative elevation of the water table for their area of interest. As illustrated in the two regional cross-sections in Figure 9, the WT0 and WT1 surfaces are very similar across much of the study area. All groundwater level data from wells are available online, directly from the ORMGP website, so that the recorded static water level at any location can be examined and compared with the water table surfaces.
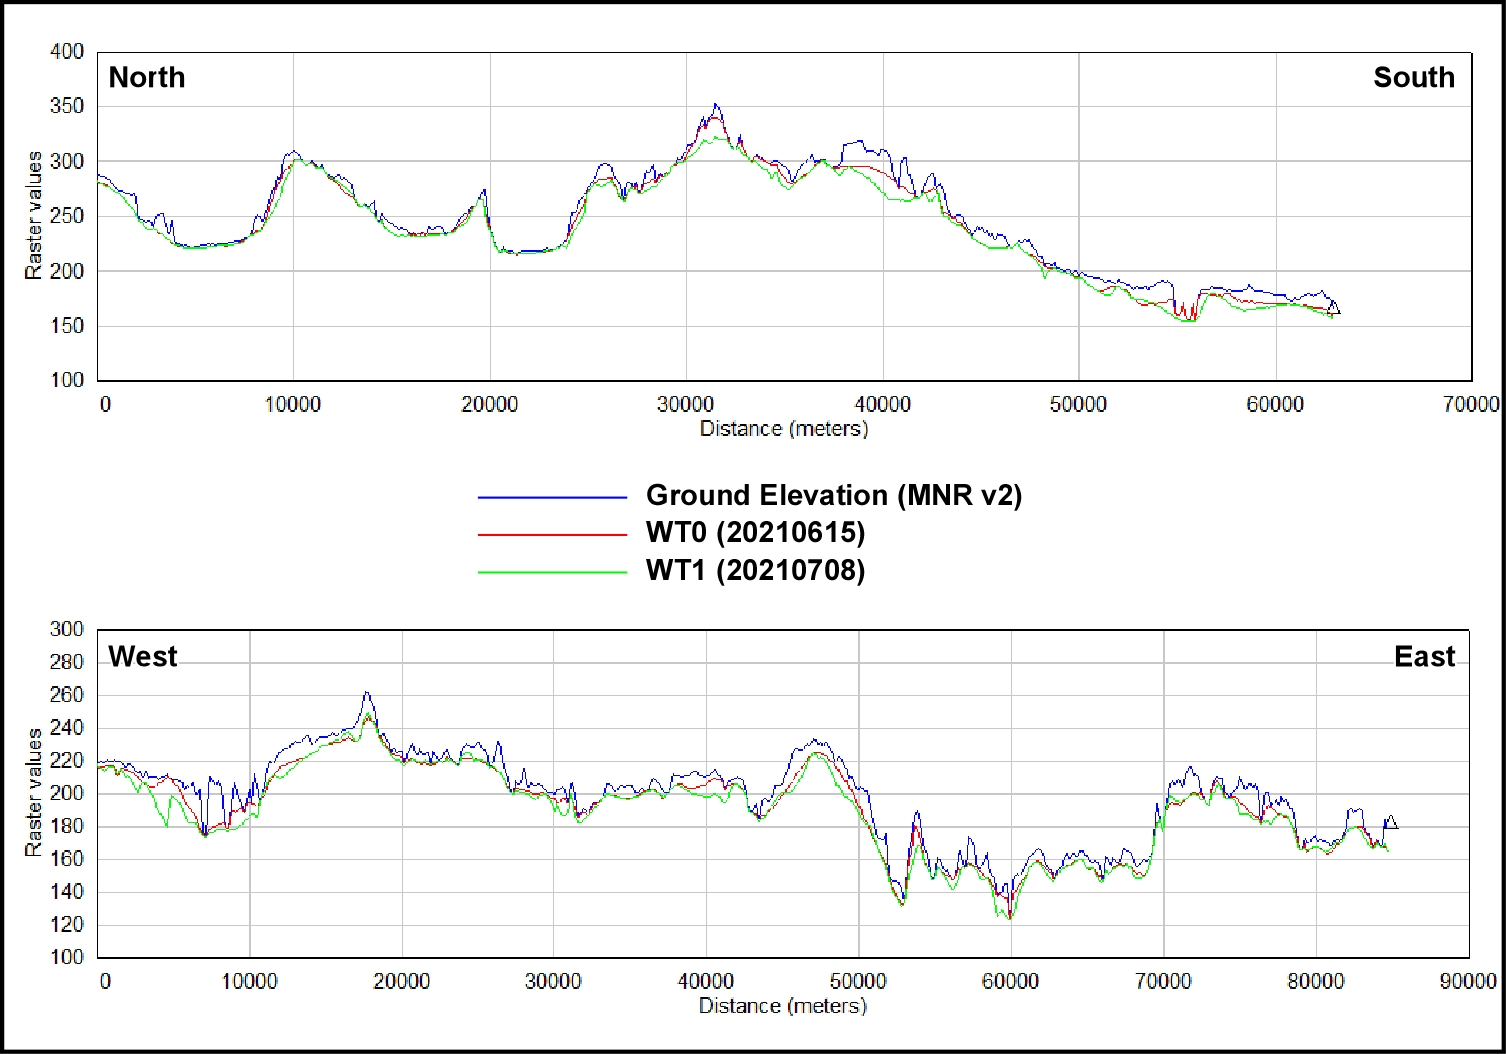
Figure 9: General West-East and North-South cross-sections showing variation of the WT0 and WT1 surfaces in comparison with the ground surface.
Any interpolated water table surface is an approximation. Field data collected through drilling and groundwater level measurement in shallow wells will be more reliable than ORMGP interpolations.
Additional Details
Water Table - Metadata (WT0 and WT1)
Potential Discharge Areas - Metadata (WT1-PDA)
Last Modified: 2022-09-19