Near Real-time Climate Data Service
NetCDF data extraction using Python
Python is a free and open source programming language that is fully capable of working with the Near Real-time Climate Data Service exported hard-copy files. Below, we’re offering a sample python script used to extract the data, calculate total precipitation, compute annual averages and post them to the 4,238 delineated sub-watersheds.
Data download
The data files required are first the sub-watershed where the climate data have been mapped:
indexed sub-watershed polygons:
PDEM-South-D2013-OWRC23-60-HC-sws10.shp
and the NetCDF files that hold the data, either:
the daily climatologies:
20240701-OWRCdailyBasins.nc
or
the 6-hourly climatologies:
20240701-OWRC6hourlyBasins.nc
Python script
For the script, we’ll be working with the 6-hourly data that are provided from 2002 to 2023. First, we need to load the requires packages:
import numpy as np
import shapefile as shp
import netCDF4 as nc
from functools import reduce
import matplotlib.pyplot as plt
import matplotlib.cm as cm
Load data
Next, we’ll load the sub-watershed shapefile:
sws = shp.Reader("PDEM-South-D2013-OWRC23-60-HC-sws10.shp")
Followed by the NetCDF file:
with nc.Dataset("20240701-OWRC6hourlyBasins.nc") as ds:
    ds.set_auto_mask(False) # https://github.com/Unidata/netcdf4-python/issues/785

    # time stamps
    tim = ds.variables['time'][:]

    # station IDs (need to convert the input character array to integer array)
    station_id = ds.variables['station_id'][:,:]
    station_id = np.int64(reduce(np.char.add, station_id.T))

    # Climate variables:
    pa = ds.variables['air_pressure'][:,:]
    ta = ds.variables['air_temperature'][:,:]
    rh = ds.variables['relative_humidity'][:,:]
    ws = ds.variables['wind_speed'][:,:]
    rf = ds.variables['rainfall_amount'][:,:]
    sf = ds.variables['snowfall_amount'][:,:]
    sm = ds.variables['surface_snow_melt_amount'][:,:]
    pe = ds.variables['water_potential_evaporation_amount'][:,:]
Compute averages
Next, calculate mean precipitation (i.e., rainfall + snowfall) at every sub-watershed, covert to mm/yr:
vmean = np.mean(rf+sf, axis=0)*365.24*4
Plot data
First, we convert the arrays to a dictionary with station_id as the lookup key, and normalized precipitation to the $[0,1]$ range:
vn, vx = np.min(vmean), np.max(vmean)
col = dict(zip(station_id, (vmean-vn)/(vx-vn)))
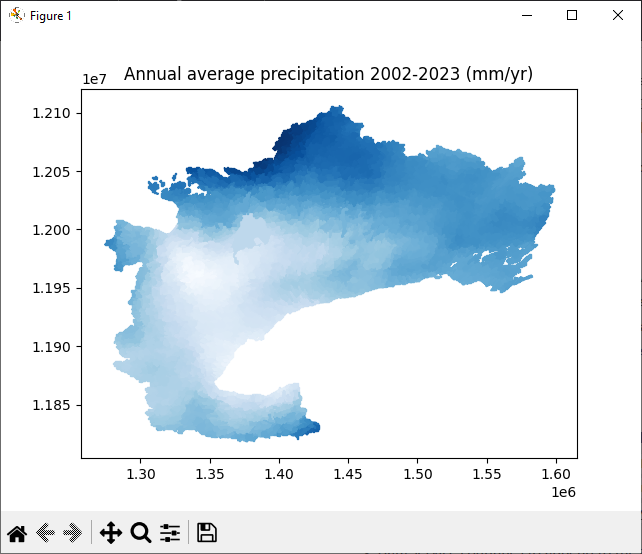
Lastly, using the ‘Blues’ colourmap, post the average precipitation values to every sub watershed and plot to a map
cmap = cm.Blues
plt.figure()
for shape in sws.shapeRecords():
    for i in range(len(shape.shape.parts)):
        cid = shape.record[0]
        v = col[cid]
        i0 = shape.shape.parts[i]
        if i==len(shape.shape.parts)-1:
            i1 = len(shape.shape.points)
        else:
            i1 = shape.shape.parts[i+1]
        x = [i[0] for i in shape.shape.points[i0:i1]]
        y = [i[1] for i in shape.shape.points[i0:i1]]
        plt.fill(x, y, color=cmap(v))
plt.title("Annual average precipitation 2002-2023 (mm/yr)")
plt.show()
Output
The resulting output:

