Near Real-time Climate Data Service
Summary
The ORMGP maintains a current, continuous daily climatology dataset beginning 1901 and a 6-hourly dataset from 2002. Every night, the automated data service web-scrapes and interpolates publicly-available climate data to some 4,200 ~10km² sub-watersheds covering our greater jurisdiction. The data are made available through our public web portal and are served using the ORMGP-FEWS system.
In the map below, the Climate Data Service is summarized at every sub-watershed. Clicking on a sub-watershed will provide a link for users to view and download the interpolated time series data.
Click on square in upper-left to bring to full screen. Clicking on sub-watershed will reveal statistics and offer link to the Climate Data Service
4,238 ~10km² sub-watersheds that make up the ORMGP Near Real-time climate data service coverage. In addition to climate data, these sub-watersheds have been attributed with land use characteristics, areas, elevations, long-term average climate, etc.
Data for download can be accessed below.
Currently, the data service offers near-realtime estimates of:
- Rainfall (Rf)
- Snowfall (Sf)
- Snowmelt (Sm)
- Air temperatures (Ta)
- daily min (Tn) and max (Tx)
- Atmospheric pressure (Pa)
- Relative humidity (Rh)
- Wind speed (Us)
- Wind direction (Ud)
- Potential evaporation (Pe)
The following document details the steps taken to support the ORMGP Near Real-time Climate Data Service. In addition to the climate data this service depends on, this page discusses how the spatial interpolation of the climate data are obtained.
Page Outline:
- Introduction: the need
- Data Service Coverage
- Data Sources
- Data Interpolation
- References
Introduction: the need
The data serve many purposes from basic time series overlay with point data sets (e.g., groundwater monitoring locations) to providing ready-made inputs to continuous hydrological models needed for, say, regionally-distributed groundwater recharge estimation.
Collection of data is constrained by public/private funding, open data sharing policies and technology, so the data served are a compilation of what is deemed the best for our partners’ needs. This necessitates data acquisition from a number of public sources.
Specifically, we are concerned about climatology at the regional scale. We cover a 3 Million hectare jurisdiction and based on our experience, compiling a continuous interpolated climate dataset requires greater emphasis on the spatial distribution of climatology over quality of data collected at (point) climate stations. That’s not to say that this is a general rule, but for our needs in our humid region with a significant winter/snowpack component, attention to how weather is distributed is of paramount importance.
Greater emphasis is made to “re-packaging” data-products from external agencies; we are not trying to re-invent the wheel. Instead, we are trying to automate a workflow that, until now, is constantly repeated by our partner agencies and partner consultants when such data are needed. We don’t require any of our partners to use our data, we are only making available the data we use in our internal analyses.
ORMGP-FEWS 2023
With funding from Environment and Climate Change Canada under the Great Lakes Protection Initiative (GLPI), as part of the Great Lakes Water Quality Agreement (GLWQA), the ORMGP climate data service was expanded from our jurisdiction to cover the entire Canadian shoreline of Lake Ontario.
This effort was a successful demonstration of the scalability of the ORMGP climate data service and now includes a 6-hourly service in addition to the original daily data service.
Highlights:
- Coverage grew from 2,813 ~10km² sub-watersheds covering 30,300 km² to 4,238 sub-watersheds covering 44,500 km².
- The ORMGP API data service includes near-realtime continuous, infilled:
- daily min/max air temperatures, rainfall, snowfall, snowmelt from 1901.
- 6-hourly air temperature, air pressure, relative humidity, wind speed, rainfall, snowmelt, potential evaporation from 2002.
- Digital files available as CF 1.8-compliant NetCDF files (*.nc).
- Available (hard-copy) data files for download (up to July, 2024–v.2406):
- indexed sub-watershed polygons:
PDEM-South-D2013-OWRC23-60-HC-sws10.shp - daily climatologies:
20240701-OWRCdailyBasins.nc - 6-hourly climatologies:
20240701-OWRC6hourlyBasins.nc
- indexed sub-watershed polygons:
- Data service continues to append to these datasets. Updated NetCDF files can be produced on request.
NOTES:
- data are compressed using 7-zip.
- NetCDF files can be opened using Panoply.
- NetCDF files can also be opened using Python.
Data Service Coverage
The service encompasses a 44,500 km² region that includes the entire Canadian portion of the Lake Ontario drainage basin. This area has been sub-divided into 4,238 sub-watersheds that are roughly 10 km² in size (see map above). These sub-watersheds are topologically connected, meaning that each have assigned their upslope and downslope neighbouring sub-watersheds, allowing for the quick collection of catchment areas and drainage pathways. At a high-level, when looking at the coverage as a whole, the sub-watershed collection appears similar to a spatial grid, only it is structured in a way that is hydrologically meaningful.
This is an important distinction because not only can the data service yield long-term infilled climate data to any user-selected point, but it can readily (i.e., on-the-fly) aggregate climatologies within a catchment area of any size. Such data aggregation is a costly component to most hydrological projects such as those involving numerical modelling.
The ORMGP Near Real-time Climate Data Service is dependent on digital elevation models (DEMs). The processing of DEMs is briefly described below. Links to detailed technical notes on the processing are provided.
Digital Elevation Model
The foundation to the climate data service (DS) is the digital elevation model (DEM). As part of the scaling exercise (v.2023) the DEM adopted was the Provincial Digital Elevation Model (PDEM) offered by the Ontario Ministry of Environment, Conservation and Parks (MECP), last updated October 16, 2023. The 30x30 m² horizontal resolution DEM was first resampled to a 60 x 60 m² resolution. The resampled DEM can be found here: PDEM-South-D2013-OWRC23-60.bil.
Hydrological correction
Next, the DEM was processed using a procedure called “hydrological correction”, which is a means of filling in sinks/depressions to ensure a continuous downslope flow direction for streams. This procedure is a common practice in hydrology when there is a need to define stream channels from DEMs where direct watercourse mapping is unavailable. Hydrological correction follows the method of Wang and Liu (2006) with some flat region adjustments following Garbrecht and Martz (1997).
The hydrological-corrected DEM can be found here: PDEM-South-D2013-OWRC23-60-HC.bil.
Sub-watershed delineation
With the hydrologically corrected digital elevation model (HCDEM), flow paths are defined using the D8-algorithm (O’Callaghan and Mark, 1984). A hill-climbing algorithm is then applied to define sub-watersheds of a specified area; here 10 km² is chosen as it is roughly the scale of a typical convective storm in southern Ontario. The v.2023 sub-watersheds can be accessed here: PDEM-South-D2013-OWRC23-60-HC-sws10.shp
See also how the sub-watersheds are topologically connected here. Clicking on any sub-watershed polygon will reveal the catchment area to the selected watershed in green, and the downslope sub-watersheds in red.
NOTES:
- data are compressed using 7-zip.
Data Sources
Below is a description of the datasets used in our overall climatology package. Precipitation, for example, comes from a multitude of sources that generally follow technological advances. In order to obtain a century+ continuous dataset, older station-based interpolation is supplanted by more recent “data assimilation systems” (DAS), where and when available.
It’s also worth noting that the density of active meteorological stations present in our jurisdiction has been in decline since the 1970s. Understandably, much of the recent investment in meteorological station operation has been dedicated to Canada’s north; a large geographical region that has been grossly overlooked yet is most susceptible to a changing climate and thus deserves greater investment.
The data source that are collected, interpolated and delivered through our web portal are referenced here. For the most part, the most recent datasets supersede the oldest. Below is a summary of the data used.
Most of the data are acquired though Meteorological Service of Canada (MSC) Open Data Service hosted by Environment and Climate Change Canada (ECCC). Near real-time station data are downloaded nightly using MSC’s Datamart and processed by the ORMGP-FEWS system as described below.
Rainfall and Snowfall
Meteorological Service of Canada
(1901—present)
Meteorological Service of Canada is a division of Environment and Climate Change Canada (ECCC). Their online historical data portal provides data collected since the mid-19th century. These data are collected at (point/local/scalar) weather stations and require spatial interpolation. Here, the nearest neighbour (i.e., Thiessen polygon) method is applied.
ECCC: Regional Deterministic Precipitation Analysis (RDPA)
The RDPA produces a best estimate of the amount of precipitation that occurred over recent past periods of 6 hours. The estimate integrates data from in-situ precipitation gauge measurements, weather radar and numerical weather prediction models. Geographic coverage is North America (Canada, United States and Mexico). Data is available at spatial resolution of 10 km. Data is only available for the surface level. Analysis data is made available four times a day for the 6-hour intervals. A preliminary estimate is available approximately 1 hour after the end of the accumulation period, and revised 6 hours after in order to assimilate gauge data arriving later. (ECCC, 2023)
(2002—present, over a sequence of versions)
The Regional Deterministic Precipitation Analysis (RDPA), which is based on the Canadian Precipitation Analysis (CaPA) system, provides a Canada-wide field of 6-hourly precipitation accumulations. The CaPA-RDPA products has gone through a number of version changes since 2002. The data are updated in near real-time, meaning that the current state of precipitation patterns can be made immediately available.
Simply put, CaPA-RDPA is an amalgamation of near-cast weather model predictions corrected by RADAR data and ground-truthed using a select set of weather stations. Essentially, CaPA-RDPA is a data assimilation system (DAS) that provides users with the best-possible spatial distribution of precipitation, necessary for analyzing hydrology at the regional scale like the ORMGP jurisdiction.
Recently (as of 2019), a high-resolution format of the RDPA system was released. The HRPDA (High Resolution Deterministic Precipitation Analysis) supplies a ~2.5 km resolution 6-hourly precipitation field, in contrast to the ~10-15 km resolution of the original RDPA product.
While the CaPA-RDPA vector data fields can be acquired from Environment Canada in GRIB2 format, the ORMGP has sourced historical/archived data from the Canadian Surface Prediction Archive (CaSPAr), as their archive holds the original raw data (ECCC’s GRIB2 format is a re-interpolation to a polar-stereographic grid). Additionally, the CaSPAr platform allows users to crop their area of interest.
Animated screen capture of CaPA-HRDPA in Delft-FEWS.
Snowmelt
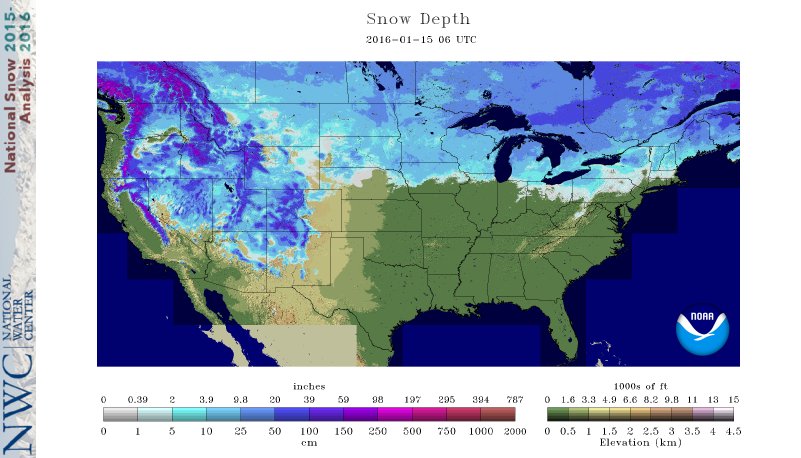
U.S. National Oceanic and Atmospheric Administration (NOAA)
SNODAS daily (2010—present)
Typically, snowmelt must be derived from snowpack ablation models. These models come in a variety of forms and sophistication. The primary source of such information comes from the Snow Data Assimilation System (SNODAS) system (NOHRSC, 2004), which offers an archive of ~1 km gridded 24-hour (UTC 06-06) snowmelt totals, published freely. The advantage of SNODAS is that we can avoid the need to model snowmelt explicitly, leveraging existing resources. The data cover our jurisdiction since late 2010.
SNODAS 6-hourly (2020—present)
SNODAS is also offered in 6-hourly states, however it is offered only for the past month. These data are scraped nightly using the ORMGP-FEWS system which also crops the data to our jurisdiction.
Cold Content Energy Balance Snowpack Model
(1901—present)
When unavailable, and prior to 2010, a cold content energy balance snowpack model is applied relying on interpolated precipitation and temperatures. The model considerers a single layered snowpack with a liquid water holding capacity.
Air Temperature
Elevations within the ORMGP region range from 75 to450 metres above sea level (masl) and thus orographic effects to temperatures are deemed negligible. The spatial distribution of minimum/maximum daily temperature is then interpolated from meteorological stations using a linear radial basis function.
All temperature data are acquired from the Meteorological Service of Canada.
Meteorological Service of Canada
Minimum and Maximum daily Temperature (1901—present)
Hourly (1953—present)
Air Pressure
Meteorological Service of Canada
Hourly (1953—present)
Atmospheric pressure data are acquired from Meteorological Service of Canada, which come in as hourly averages. In contrast to temperatures, elevation does have am impact on pressure distribution and thus corrections are made. Once corrected, the hourly data are then aggregated to 6-hourly averages. (Hourly data are still maintained and can be made available upon request.)
Relative Humidity
Meteorological Service of Canada
Hourly (1953—present)
Hourly relative humidity data are acquired from Meteorological Service of Canada and are aggregated to 6-hourly averages.
Wind Speed
Meteorological Service of Canada
Hourly (1953—present)
Wind speed and direction data are acquired from Meteorological Service of Canada. Wind speeds only are aggregated to 6-hourly averages.
Potential Evaporation
Modelled
Hourly (1953—present)
The final 6-hourly dataset made available through the data service is potential evaporation $ (E_a) $ derived using the Penman wind function:
\[E_a=7.46\times 10^{-6} \cdot d_a \cdot f(u) \qquad \text{(mm/s)}\]where $d_a$ is the vapour pressure deficit (Pa) and $f(u)$ is an empirical wind-function (m/s), where $u$ is wind speed (m/s).
The advantage here is the ability to neglect the need for for the radiative terms used in Penman-Monteith (1965), Priestly-Taylor (1972), Jensen-Haise (1963), etc.—a rare data set that is hard to interpolate due to the influence of cloud cover–good to avoid. Calibration of the model has been made against pan evaporation stations.
Data Interpolation
With the exception of CaPA-HRDPA and SNODAS, point/station data require spatial interpolation to achieve a contiguous distribution of climactic variables. These data are automatically interpolated to every 10 km² sub-watersheds using Delft-FEWS. See here for more details on the interpolation techniques used on every climate variable offered with the data service.
References
Garbrecht and Martz 1997 The assignment of drainage direction over flat surfaces in raster digital elevation models
National Operational Hydrologic Remote Sensing Center. 2004. Snow Data Assimilation System (SNODAS) Data Products at NSIDC, Version 1. Boulder, Colorado USA. NSIDC: National Snow and Ice Data Center. doi: https://doi.org/10.7265/N5TB14TC.
O’Callaghan, J.F., and D.M. Mark, 1984. The extraction of drainage net-works from digital elevation data, Comput. Vision Graphics Image Process., 28, pp. 328-344
Wang, L., H. Liu, 2006. An efficient method for identifying and filling surface depressions in digital elevation models for hydrologic analysis and modelling. International Journal of Geographical Information Science 20(2): 193-213.